Compounding and Foreign Policy

In today’s Business Standard, Nitin Pai writes about something he’s mentioned a few times before – that India’s best China/Pakistan/US policy is “8% growth”. Unfortunately a lot of space in his piece talks about appointments in ministries and cabinet formation, and he doesn’t directly touch upon why 8% growth is a viable foreign policy (it is possible he had mentioned this but got edited away).

There are two primary reasons why strong economic growth makes for good foreign policy. Firstly, a fast growing economy means that others will want to get their share in it. If you are growing at a rate much higher than the other big economies, other countries will want to piggyback on your growth. They will want to trade with India, invest in India and  get India to invest in their respective countries. And for any of this to happen, the foreign country will need to have an overall good relationship with India – if they piss off India, they can get left out of partaking in India’s economic growth. And that will ensure good foreign relations.

The second reason has to do with compounding. Assuming that India can afford to spend only a fixed percent of its tax revenues on defence (being a democracy, the government will always have commitments towards welfare and infrastructure spending which cannot be touched), and assuming that taxes as a proportion of GDP are constant, this means that India’s defence spending is likely to be proportional to the GDP.

With 8% growth, India’s real GDP expected to double in about 9 years’ time. Or, our defence budget can double in 9 years’ time. With only about 5% growth (as we have now), in 9 years our GDP, and consequently our defence budget, will only increase by 50%! That is the power of compounding, and that shows you how increased economic growth can lead to greater defence spending, by keeping proportion of defence spending constant!

So much for Nandan Nilekani’s big data campaign

I got a call a couple of hours back on my landline. The wife picked and was asked to transfer the call to me. When she mentioned that I was busy she was asked about what we think of Nandan Nilekani and whether we are considering voting for him. She told them that we are registered to vote in Bangalore North and hence our opinion of Nilekani doesn’t matter.

I don’t know how the Nilekani campaign team got hold of our phone number. Even if they got from some database I don’t know how they assumed we are registered to vote in Bangalore South. For ours is a bsnl landline and bsnl landlines in Bangalore have a definite pattern that most people in Bangalore are aware of.

Back before 2002 or so when landline numbers in Bangalore got their eighth digit (a leading two) the leading digit of a Bangalore number gave away the broad area.

Numbers in South Bangalore started with 6. A leading 2 meant the number was from the government office dominated areas. A leading 5 was for mg road and the north and east of the city (he cantonment area, indiranagar, koramangala etc) and a leading 3 meant it was a northwest bangalore (malleswaram to vijayanagar) number. 8 was reserved for the outskirts.

Now while Bangalore has expanded significantly these patterns are broadly in place. All you need to do to know where a number is located is to look at the second digit – a 3 there still refers to the north and west sides of the city.

Among the areas of Bangalore that make up Nilekani’s constituency the only one that has a second digit of 3 is vijayanagar (and surrounding areas including the govindrajnagar constituency). From that perspective the likelihood of a number with second digit 2 being in Nilekani’s constituency is really low. Clearly their supposed big data algorithm hasn’t picked that!!

Forget just the second digit – look further down the number. It is public information that 2352 is one of the codes of the Rajajinagar telephone exchange, and all numbers covered by that exchange lie in either bangalore north or Central!!

I wasn’t particularly convinced about Nilekani’s use of big data in the first place – it seemed like the usual media hype – now I think that while his campaign team does use data their use of it is not particularly good. The case that the team in charge of the data analysis for Nilekani lacks any domain knowledge of the city.

Market Share Of Indian Air Operators

Not so long ago, we had a CAG report that discouraged giving sixth freedom rights to Gulf-based airlines, the argument being that it was reducing the market share of Indian airline companies, and was reducing the chances of Delhi airport ever becoming a hub. In that report, the CAG had also claimed that the granting of these sixth freedom rights was hurting the financial performance of Air India.

The Ministry of Civil Aviation, via the government data portal, has put out data on the market share (in terms of number of passengers and amount of cargo) of Indian and Foreign airlines for flights to and from India. While the data strangely refuses to mention the units for some of the variables, that doesn’t prevent us from calculating the market share of Indian carriers in the passenger and freight markets. The graph below summarizes this:

airlinemarketshare


What is interesting is that the market share of Indian carriers in terms of both passengers and freight grew significantly between 2006 and 2011, slowing down a bit towards 2012 (wonder if Kingfisher’s demise adequately explains that). While this was the time when many of those sixth freedom rights (that the CAG was so opposed to) were granted, this was also the time period when privately owned Indian airlines started expanding globally and adding international routes.

This suggests that the reason for Air India’s losses lie less in the grant of the sixth freedom rights – which only grew the market, and more to do with the quality of service provided by the airline vis-a-vis both foreign carriers and privately owned Indian carriers.

What can also be seen from the above graph is that there is perhaps significant scope for expansion of Indian carriers when it comes to Air Cargo where their market share is minuscule compared to their passenger market share.

Warming the house

Midway through my housewarming function on Sunday, I had a “Lawrence of Arabia” moment. In the movie, Lawrence, a reluctant soldier has to execute a guy named Gasim in the Arab army he is leading. Lawrence shoots Gasim, and then finds that he actually enjoys killing people. This is probably one of the pivotal moments in the story.

My day had begun badly, as the priests who were supposed to turn up by 5, did not make their appearance until a full hour later. What was interesting was that the photographer, who had been asked to turn up at 630 came in a full hour earlier. With the priests not coming in till it was close to 6, I was going bonkers, and declaring war on the priest community, and regretting that I had agreed for a religious ceremony at all.

They arrived soon, however, and off I went to change into a silk panche (not a great idea for summer). And I heard clapping and shouting outside. Three eunuchs had invaded the house and were refusing to leave until they had been paid Rs. 1100. I must mention this was the first time I had been so harassed. And these people were refusing to negotiate or bow to threats. Finally the demanded sum was paid and off they went. This transaction has been recorded in my housewarming ceremony income and expenses statement.

My official family priest, who was unable to make it thanks to an earlier booking, had mentioned that the complexities of handling a housewarming meant that we had to employ four priests. Any doubts of any value that multiple priests added were dispelled in the first few minutes of the ceremony beginning. One priest with a good voice chanting mantras can occasionally be pleasing to hear. But four priests singing in tandem, not all of them at the perfect pitch – which created a nice effect – and not all of them singing simultaneously, was phenomenal. Their chants reverberated off the walls of the empty house (not too many people want to turn up for a ceremony at 7 am on a Sunday, so we had spared most guests the moral agony and had invited them only for lunch), and when it was accompanied by the ringing of bells, as it was occasionally, it was absolutely mindblowing.

It was around this time that I had the Lawrence of Arabia moment. After all my protestations against religious ceremonies and suchlike, I discovered that I was actually enjoying the process. The sound was fantastic. With significant hand-holding from the priest what I had to do was also enjoyable – throw flowers into one area at irregular intervals. I could construct my own little games (not unlike Pee-ball) and it was a lot of fun.

After a short break for coffee and a longer one for breakfast (technically you are supposed to fast during such events but such rules have become flexible nowadays), it was time for the “homa” or throwing things into the ritual fire as an offering to the fire god Agni and his wife Swaha. I didn’t start the fire. It was initially lit using burning camphor by two aunts. It was fueled mostly by the priests (another time when multiple priests came in handy – two chanted the mantras while the other two kindled the fire).

My role here was to occasionally pour in ghee using the small wooden ladle, and then later put in “modaks” (fried momos filled with coconut and sugar) into the fire. Again I invented my own little games. How do you throw the modak such that it immediately catches fire? How do you ensure the modak doesn’t bounce outside of the fire pot? Can you create patterns with the burning modaks?

Midway through this ritual I started imagining doing a barbecue on this ritual fire (this thought was fueled by a particular modak, which on partial burning, started looking like a piece of grilled chicken). A couple of days earlier I had imagined what would happen if illegal weeds were to be procured and added to the ritual fire. The wife and I had then thought that the original intended purpose of such rituals was communal bakery.

We had planned to finish the ceremonies by 9:30, so that we could prepare to receive guests who would arrive around 11. The problem is that if you are the only person(s) who know certain guests, they can get lost and bored if you are stuck in rituals. Hence we had planned the rituals such that we could be ready to receive guests by the time they arrived. We had built in an hour an a half of slack (9:30 to 11), and it came of good use as the rituals ceased at 10:30 (the hour’s delay being a function of the delay in priests’ arrival).

Guests came, saw, ate and went. Around 5 in the evening the wife started cleaning the house. By 8, there were no traces of a ceremony having happened there. And we went out.

Tradition demands you spend a night in the new house even if you don’t intend to move in immediately. We went to bed at 12, after having opened the presents. Initially sleep was good. Then we got woken up at 430 by a pack of dogs that were prowling the streets and fighting. Then we tried to get back to sleep, but were again woken up by the nearby mosque’s azaan. I hope this isn’t a sign of things to come once we move.


The WhatsApp Effect

On the national data site (data.gov.in) the Telecom Regulatory Authority of India (TRAI) has put out some data on GSM telephony in the last five years. This has aggregate all-India data, and one of the data points available is “Outgoing SMS per subscriber per month”. The following graph plots this data over time:

sms1


Notice how the number of SMSs per user which rose sharply till mid 2011 then started suddenly dropping off! There seems to be a minor revival between March and June 2012, but apart from that it seems to be a secular decline. I can’t think of any reason apart from the profusion of smartphones and messaging apps on such phones such as WhatsApp, WeChat, etc. for this decline.

The total number of GSM subscribers also shows an interesting pattern,  going by the TRAI data. There is massive increase in the number of subscribers till 2012, and then the graph flatlines!

telsubscrib


The only reason  I can think of for this is that there might have been some sort of a subscriber clean up in 2012. If you remember, when telcos introduced “unlimited subscription” plans for prepaid mobiles back in 2006, these so-called “unlimited plans” expired sometime in 2012. This was on account of re-auction of telecom spectrum that year. It is possible that users who were “active” only because of possession of unlimited plans were weeded out after 2012, and hence the flatline. Otherwise, the above trajectory is hard to believe.

Finally, what about the telecom tariffs? The supplied data set has information on the Average Revenue Per User (ARPU) per month, and the number of outgoing minutes of usage per subscriber. Assuming SMSs don’t cost anything (wrong assumption – since they do), we can calculate the telecom tariffs (in Rs. per minute). The following graph shows that:

teltariffs


Back in 2009, tariffs were close to a rupee a minute. However, between 2009 and 2010, tariffs dropped sharply, to the range of about 60 paisa per minute, which comes down to a paisa a second! Interestingly, tariffs have remained constant ever since.

Standard deviation is over

I first learnt about the concept of Standard Deviation sometime in 1999, when we were being taught introductory statistics in class 12. It was classified under the topic of “measures of dispersion”, and after having learnt the concepts of “mean deviation from median” (and learning that “mean deviation from mean” is identically zero) and “mean absolute deviation”, the teacher slipped in the concept of the standard deviation.

I remember being taught the mnemonic of “railway mail service” to remember that the standard deviation was “root mean square” (RMS! get it?). Calculating the standard deviation was simple. You took the difference between each data point and the average, and then it was “root mean square” – you squared the numbers, took the arithmetic mean and then square root.

Back then, nobody bothered to tell us why the standard deviation was significant. Later in engineering, someone (wrongly) told us that you square the deviations so that you can account for negative numbers (if that were true, the MAD would be equally serviceable). A few years later, learning statistics at business school, we were told (rightly this time) that the standard deviation was significant because it doubly penalized outliers. A few days later, we learnt hypothesis testing, which used the bell curve. “Two standard deviations includes 95% of the data”, we learnt, and blindly applied to all data sets – problems we encountered in examinations only dealt with data sets that were actually normally distributed. It was much later that we figured that the number six in “six sigma” was literally pulled out of thin air, as a dedication to Sigma Six, a precursor of Pink Floyd.

Somewhere along the way, we learnt that the specialty of the normal distribution is that it can be uniquely described by mean and standard deviation. One look at the formula for its PDF tells you why it is so:
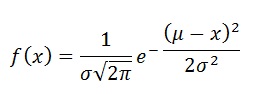
Most introductory stats lessons are taught from the point of view of using stats to do science. In the natural world, and in science, a lot of things are normally distributed (hence it is the “normal” distribution). Thus, learning statistics using the normal distribution as a framework is helpful if you seek to use it to do science. The problem arises, however, if you assume that everything is normally distributed, as a lot of people do when they learn deep statistics using the normal distribution.

When you step outside the realms of natural science, however, you are in trouble if you were to blindly use the standard deviation, and consequently, the normal distribution. For in such realms, the normal distribution is seldom normal. Take, for example, stock markets. Most popular financial models assume that the movement of the stock price is either normal or log-normal (the famous Black-Scholes equation uses the latter assumption). In certain regimes, they might be reasonable assumptions, but pretty much anyone who has reasonably followed the markets knows that stock price movements have “fat tails”, and thus the lognormal assumption is not a great example.

At least the stock price movement looks somewhat normal (apart from the fat tails). What if you are doing some social science research and are looking at, for example, data on people’s incomes? Do you think it makes sense at all to define standard deviation for income of a sample of people? Going further, do you think it makes sense at all to compare the dispersion in incomes across two populations by measuring the standard deviations of incomes in each?

I was once talking to an organization which was trying to measure and influence salesperson efficiency. In order to do this, again, they were looking at mean and standard deviation. Given that the sales of one salesperson can be an order of magnitude greater than that of another (given the nature of their product), this made absolutely no sense!

The problem with the emphasis on standard deviation in our education means that most people know one way to measure dispersion. When you know one method to measure something, you are likely to apply it irrespective of whether it is the appropriate method to use given the circumstances. It leads to the proverbial hammer-nail problem.

What we need to understand is that the standard deviation makes sense only for some kinds of data. Yes, it is mathematically defined for any set of numbers, but it makes physical sense only when the data is approximately normally distributed. When data doesn’t fit such a distribution (and more often than not it doesn’t), the standard deviation makes little sense!

For those that noticed, the title of this post is a dedication to Tyler Cowen’s recent book.

Internet subscribers in India

The government data portal has released data on the number of internet subscribers in India over the last 5 years.

Going by this data, the number of internet subscribers increased steadily until 2012, but then decreased a bit between 2012 and 2013.

bb1


The market  grew 19% from 2009 to 10, 22% from 10 to 11, before slowing down to a growth of only 13% between 2011 and 2012, and actually decreasing by 5% to 2013.

The question is whether the market share growth varied by provider. The next two graphs show the total number of subscribers per provider and the market share of major providers, respectively. All data here is from data.gov.in

bb2


It is interesting that while BSNL continues to grow, the number of subscribers of MTNL has gone down. This graph also helps put perspective on how small Airtel is!

bb3
What would add to this analysis is data on how much data actually passes through the pipes of various providers – once that is taken into account, I think we should see that market share of providers such as Airtel and RCom (which supply to businesses) would b e much higher.

Biometrics for Aadhaar reflects a lack of social trust and law enforcement

As far as I’m concerned, the primary purpose of Aadhaar is for targeting subsidies. Right now we have a regime where subsidies are targeted on a household basis, which is incorrect and inefficient. What we need is a methodology to target subsidies to individuals, and for this purpose, we need a way to uniquely identify individuals.

Hence, we need a unique identification mechanism. The problem with existing IDs, such as the passport, driving licence and permanent account number (PAN) is that there is no guarantee of de-duplication. There is nothing that prevents one individual to hold multiple of these – though it might be illegal to do so. There is no formal mechanism of de-duplication in any of these – and the rather unstructured form of Indian names and addresses means that it is going to be extremely difficult to weed out duplicates of these at scale.

This is only my conjecture, but this might be the reason why the government decided to create a completely new ID, which one could obtain only if one were to give their biometric details. The argument here is that biometrics uniquely identify a person, though there are counterarguments to this which argue that it is possible in extremely rare cases (which is not rare enough, given India’s size) for two people to have biometrics that are considered identical by the de-duplication system.

India is not the only country to have aspired to issue a unique identity card for its residents. What sets India apart is the size and the fact that sharing of biometrics with the issuing agency is a necessary condition for issuing the ID card. That we have to resort to a system based on biometrics is a reflection of both the lack of social trust and the lack of law enforcement in India. That we have lack of social trust is indicated by the fact that people aspire to hold more than one “unique identity proof” – such as a PAN or a driving license or a passport. That we have weak law enforcement is indicated by the fact that existing punishments for holding duplicate IDs is not deterrent enough for people who aspire to hold multiple cards.

It can be argued that using biometrics to ensure that each resident has only one ID is an engineer’s solution to a policy problem. It is an admission of the fact that our legal enforcement is too weak to enforce unique IDs without a technological basis. It is sad that we had to go down this route without exploring policy solutions first (or maybe we did, and they didn’t go anywhere).

Calibration and test sets

When you’re doing any statistical analysis, the standard thing to do is to divide your data into “calibration” and “test” data sets. You build the model on the “calibration” data set, and then test it on the “test” data set. The purpose of this slightly complicated procedure is so that you don’t “overfit” your model.

Overfitting is the process where in your attempt to find a superior model, you build a model that is too tailored to your data, and when you apply it to a different data set, it can fail spectacularly. By setting aside some of your data as a “test” data set, you make sure that the model that you built is not too calibrated to the data use used to calibrate it to.

Now, there are several methods in which you can divide your data into “calibration” and “test” data sets. One method is to use a random number generator, and randomly divide the data into two parts – typically the calibration data set is about three times as big as the test data set (this is the rule I normally use, but there is no sanctity to this). The problem with this method, however, is that if you are building a model based on data collected at different points in time, any systematic change in behaviour over time cannot be captured by the model, and it loses predictive value. Let me explain.

Let us say that we are collecting some data over time. What data it is doesn’t matter, but essentially we are trying to use a set of variables to predict the value of another variable. Let us say that the relationship between the predictor variables and the predicted variable changes over time.

Now, if we were to build a model where we randomly divide data into calibration and test sets, the model will build will be something that will take into account the different regimes. The relationship between the predictor and predicted variables in the calibration data set is likely to be identical to the relationship between the predictor and predicted variables in the test data set – since both have been sampled uniformly across time. While that might be good, the problem is that this kind of a model has little predictive value.

Another way of splitting your data into calibration and test period is by splitting it over time. Rather than using a random number generator to split data into calibration and test parts, we simply use time. We can say that the data collected in the first 3/4th of the time period (in which we’ve collected the data) forms the calibration set, and the last 1/4th forms the test set. A model tested on this kind of calibration and test data is a stronger model, for it has predictive value!

In real life, if you have to predict a variable in the future, all you have at your disposal is a model that is calibrated on past data. Thus, you need a model that works across time. And in order to make sure you model can work across time, what you need to do is to split your data into calibration and test sets across time – that way you can check that model built with data from one time period can indeed work on data from a following time period!

Finally, how can you check if there is a “regime change” in the relationship between the predictor and predicted variables? We can use the difference in splitting data into calibration and test sets!

Firstly, split the data into calibration and test sets randomly. Find out how well the model explains the data in the test set. Next, split the data into calibration and test sets by time. Now find out how well the model explains the data in the test set. If there is not much difference in the performance of the model on the test set in these two cases, it means that there is no “regime change”. If there is a significant difference between the performance of the two models, it means that there is a definite regime change. Moreover, the extent of regime change can be evaluated based on the difference in goodness of fit in the two cases.

Dictatorships and primaries

In their excellent book “the dictator’s handbook” Bruno bueno de Mesquita and Alastair smith talk about why dictatorships usually put on a garb of democracy and hold (mostly) sham elections.

According to bueno de Mesquita and smith the reason is not to appear good in front of the international community, as the general discourse goes. Dictators are extremely rational actors, they say, and reputation in the international community didn’t usually give enough benefit to compensate for the cost of the garb of democracy and elections.

Instead, bueno de Mesquita and smith say that the real purpose of the elections is to keep followers in check. If a member of the dictator’s team “misbehaves” for example, getting rid of him is normally a difficult process. Essentially sacking is a hard job for anyone, even for hard nosed dictators. In the context of dictatorships sackings can get controversial and often bloody and is not a particularly pleasant process.

By putting in a garb of democracy, however, there is an easy way to sack an official. Assuming that in a dictatorship most citizens vote according to the fancies of the dictator, all a dictator needs to do to sack an official is to instruct the electorate to vote against the official the next time he is up for reelection. The sacking having been effected by “popular mandate”, the process is easier and likely to be less bloody and troublesome for the dictator.

Now, the question is if we can use this framework to understand the new US-style primary elections that the Indian national congress has been using for candidate selection in some constituencies in the forthcoming elections.

Normally in the congress, like in most other parties in India, candidates for elections are determined top-down, by the party “high command”. The risk with this however is that candidates who did not get a ticket to contest the elections know that for whatever reason the party high command is not in favour of them contesting. This can lead to disillusionment and can lead to defections to rival parties.

In this context a primary election acts as a facade through which the party high command can get its choice of candidates without pissing off those applicants who did not get the ticket. Now the purported message to these unsuccessful applicants is that the next time they should work of getting the support of the party rank and file in their constituency.

In reality however, with the party being high command driven, the rank and file has voted as per the instructions of the high command! The high command thus gets its choice of candidates without losing the support of the unsuccessful candidates.

So why is it that primaries work in the US? For the same reasons that elections work in democracies! In the US parties are truly democratic and organised bottom up. There is no high command there to (credibly) dictate the choices for the rank and file. So the results of the primaries are truly reflective of the opinion of the party rank and file.

In conclusion, given the high command based structure of political parties in India, primaries will not work. Instead they will only end up as instruments in the hands of the party high commands, just like the sham elections on dictatorships.