Reliving my first ever cricket match

Earlier this week, I came cross the recent Sky Sports documentary “spin wash” – about England’s 3-0 Test series defeat in India in 1993. That’s a rather memorable series for me, since it was the first time that I actually saw India win, and win comfortably (I had started watching cricket on my ninth birthday, with the 126-126 tie at Perth).

Prior to the series I remember chatting with an “uncle” at the local circulating library, and he asked me what I thought would happen to the series. I had confidently told him that England would win comfortably. I was  very wrong.

Anyway, one video led to another. I finished the series, and then remembered that it was during the same tour that I had gone for my first ever cricket match. It was an ODI in Bangalore, either the 3rd or the 4th of the series (depending on whether you count the first ODI in Ahmedabad that got cancelled). This came just after the “spin wash” and the expectations from the Indian team were high.

A granduncle who was a member at the KSCA had got us tickets, and my father and I went to see the game. I remember waking up early, and first going to my father’s office on his scooter. I remember him taking a few printouts in his office (a year earlier he had got a big promotion, and so had both a computer and a printer in his private office), and then leaving me there as he went upstairs to drop it off in his manager’s (the finance director) office.

Then we drove to the ground in his scooter. I don’t remember where we parked. I only know there was a massive line to get in, and we somehow managed to get in before the game began. I also remember taking lots of food and snacks and drinks to eat during the game. While entering the group, I remember someone handing over large “4” placards, and cardboard caps (the types which only shaded the eyes and were held at the back by a string).

Anyway, back to present. I searched for the game on YouTube, and duly found it. And having taken the day off work on account of my wife’s birthday, I decided to watch the highlights in full. This was the first time I was watching highlights of this game, apart from the game itself that I watched from the B stand.

Some pertinent observations about the video, in no particular order:

  • The outfield was terrible. You see LOTS of brown patches all over the place. When you see Paul Jarvis come in to bowl, you see a very reddish brown all over his trousers – you don’t really see that colour in (even red ball) cricket now
  • There was a LOT of rubbish on the outfield. Random paper and other things being thrown around. Remember that this was prior to the infamous 1999 game against Pakistan in Bangalore where the crowd threw lots of things on to the pitch, so I’m not sure there was anything to prevent things from being thrown on the pitch
  • The India shirt was sponsored by some “Lord and Master”. I don’t remember at all what that is. Never seen its ads on TV (and I watched a lot of TV in the 1990s).
  • There was a hoarding by the Indian Telephone Industries (state owned telephone manufacturing monopoly that collapsed once the monopoly was broken) that said “allrounders in communications”. I found it funny.
  • There were lots of hoardings by the local business Murudeshwar Ceramics / Naveen Diamontile. The business still exists, but it’s interesting that a local player got hoarding space – I guess TV wasn’t yet a big deal then
  • There was a hoarding by “Kuber finance”. I found that interesting since we’ve almost come a full circle with “Coinswitch Kuber” ads during the 2021 IPL.
  • The Bangalore crowd looked MASSIVE on TV. and the Sky Sports commentators kept referring to how big a crowd it was. Coming soon after Test matches in Calcutta, Madras and Bombay, this is “interesting”.
  • Every time the camera panned towards the B stand in the highlights reel, I tried to look for myself (I was 10 years old at the time of the game!). No success of course. But I do remember stuff like Srinath getting his 5-41 bowling from “our end” (BEML End, going away from where I was sitting). And Sidhu fielding right in front of us at third man when India was bowling from the pavilion end
  • I remember leaving the ground early after India collapsed (from 61-1 to 115-7). I remember my father saying that there would be riots once the match finished and we should get out before that. One of my school classmates who also went to the game said he watched till the very end and I was jealous of him.
  • The highlights showed Mexican waves. I clearly remember enthusiastically participating in those
  • This was 3.5 years before the famous Kumble-Srinath partnership in Bangalore against Australia but from the highlights I see that Kumble and Kapil Dev had started one such partnership in this game. Again I remember none of it since I had left the ground by then.
  • I’ll end with a poem. I had written it on the day of the game, on the back of the “4” placard I had been given while entering the ground, and waving it every time it seemed the camera was facing my section of the crowd.

Graeme Hick
You’ll get a kick
From a mighty stick
And you’ll fall sick

He ended up top scoring in the game.

Confusing with complications

I’m reading this awesome article by Srinivas Bhogle (with Rajeeva Karandikar) on election forecasting. To be fair, not much of the article is new to me – it’s just a far more readable version of Karandikar’s seminal presentation on the topic made at IIT Kanpur all those years back.

However, as with all good retellings, this story also has some nice tidbits. This one has to do with “index of opposition unity”. The voice here is Bhogle’s:

It is easy to understand why the IOU becomes so critical in such situations. But, and here’s the rub, the exact mathematical formula connecting IOU to the seat count prediction is not easy to find. I searched through the big and small print of The Verdict by Dorab Sopariwala and Prannoy Roy, but the formula remained elusive.

Rajeeva suggests that it was likely based on simple heuristics: something like ‘if the IOU is less than 25%, give the first-placed party 75% of the seats.’ It may also have involved intelligent tweaking based on current survey data, historical data, informal feedback, expert opinion, gut feeling, and so on.

I first came across the IOU in Prannoy Roy and Dorab Sopariwala’s book. The way they had presented in the book, it seemed like it is a “major concept”. It seems, like I did, Bhogle also looked through the book trying to find a precise formula, and failed to do so.

And then Karandikar’s insight above is crucial – that the IOU may not be a precise mathematical formula, but just an intelligent set of heuristics, involving intelligent tweaking.

Sometimes putting a fancy name (or, even better, an acronym) on something can help lend credibility to the concept. For example, IOU is something that has been championed by Roy and Sopariwala for years, and they have done so to a level where it has become a self-fulfilling prophecy, and a respected scientist for Bhogle has gone searching for its formula!

Also, sometimes, telling people that you “used an intelligent heuristic” to come up with a conclusion can lead you to be taken less seriously. Put on a fancy name (even if it is something that you have yourself come up with), and the game changes. You suddenly start to be taken more seriously, like Ganesha assumed when he started sending fan mail under the name “YG Rao”.

And like they say in The Usual Suspects, sometimes the greatest trick that the devil ever pulled was to convince you that he exists. It is the same with “concepts” such as IOU – you THINK they must be sound because they come with a fancy name, when all that they apeear to represent is a set of fancy heuristics.

I must say this is excellent marketing.

Opinion polling in India and the US

(Relative) old-time readers of this blog might recall that in 2013-14 I wrote a column called “Election Metrics” for Mint, where I used data to analyse elections and everything else related to that. This being the election where Narendra Modi suddenly emerged as a spectacular winner, the hype was high. And I think a lot of people did read my writing during that time.

In any case, somewhere during that time, my editor called me “Nate Silver of India”.

I followed that up with an article on why “there can be no Nate Silver in India” (now they seem to have put it behind a sort of limited paywall). In that, I wrote about the polling systems in India and in the US, and about how India is so behind the US when it comes to opinion polling.

Basically, India has fewer opinion polls. Many more political parties. A far more diverse electorate. Less disclosure when it comes to opinion polls. A parliamentary system. And so on and so forth.

Now, seven years later, as we are close to a US presidential election, I’m not sure the American opinion polls are as great as I made them out to be. Sure, all the above still apply. And when these poll results are put in the hands of a skilled analyst like Nate Silver, it is possible to make high quality forecasts based on that.

However, the reporting of these polls in the mainstream media, based on my limited sampling, is possibly not of much higher quality than what we see in India.

Basically I don’t understand why analysts abroad make such a big deal of “vote share” when what really matters is the “seat share”.

Like in 2016, Hillary Clinton won more votes than Donald Trump, but Trump won the election because he got “more seats” (if you think about it, the US presidential elections is like a first past the post parliamentary election with MASSIVE constituencies (California giving you 55 seats, etc.) ).

And by looking at the news (and social media), it seems like a lot of Americans just didn’t seem to get it. People alleged that Trump “stole the election” (while all he did was optimise based on the rules of the game). They started questioning the rules. They seemingly forgot the rules themselves in the process.

I think this has to do with the way opinion polls are reported in the US. Check out this graphic, for example, versions of which have been floating around on mainstream and social media for a few months now.

This shows voting intention. It shows what proportion of people surveyed have said they will vote for one of the two candidates (this is across polls. The reason this graph looks so “continuous” is that there are so many polls in the US). However, this shows vote share, and that might have nothing to do with seat share.

The problem with a lot (or most) opinion polls in India is that they give seat share predictions without bothering to mention what the vote share prediction is. Most don’t talk about sample sizes. This makes it incredibly hard to trust these polls.

The US polls (and media reports of those) have the opposite problem – they try to forecast vote share without trying to forecast how many “seats” they will translate to. “Biden has an 8 percentage point lead over Trump” says nothing. What I’m looking for is something like “as things stand, Biden is likely to get 20 (+/- 15) more electoral college votes than Trump”. Because electoral college votes is what this election is about. The vote share (or “popular vote”, as they call it in the US (perhaps giving it a bit more legitimacy than it deserves) ), for the purpose of the ultimate result, doesn’t matter.

In the Indian context, I had written this piece on how to convert votes to seats (again paywalled, it seems like). There, I had put some pictures (based on state-wise data from general elections in India before 2014).

An image from my article for Mint in 2014 on converting votes to seats. Look at the bottom left graph

What I had found is that in a two-cornered contest, small differences in vote share could make a massive difference in the number of seats won. This is precisely the situation that they have in the US – a two cornered contest. And that means opinion polls predicting vote shares only should be taken with some salt.

Halls and Hallways

It is possibly only in India that the living room is also called the “hall”. In the  UK, where I briefly lived, for example, the “hall” in the home refers to the hallway, the little passage that connects together all rooms. Actually, thinking about it, it is not surprising that the living room in India is called the “hall”, since it also performs the job of the hallway.

We rearrange the furniture in our home fairly often. Recently we had people moving in downstairs after that house had been empty for over a year. The first thing we told the new neighbours was that we rearrange our furniture rather often, and we’ll try our best to do it without noise.

That said, most of our recent rearrangements have involved the bedrooms. The living room has been left alone, since we’ve been completely unable to “plan and draw”(as my chemistry teacher used to say in class 12 while teaching us orbital diagrams).

The problem, we realise, is that our living room has “too many orifices”. It is a rather large room that combines the living room and the dining room. The main entrance into the house leads into it. And one bedroom, the kitchen, one balcony and (finally) the hallway that lead the two other bedrooms and one bathroom lead from it.

This large number of orifices for our living room means that there are few “U-shaped spaces” which can be converted into nice living quarters, with a TV, and comfy sofas, and what not.

And when I think about all the other houses I’ve lived in in India, this has been true there as well – the living rooms have had too many orifices, and the houses haven’t sufficiently made use of hallways to separate out rooms. The result, everywhere, has been living rooms where you have televisions that don’t sit directly opposite sofas, living rooms where the sofas are massively misaligned, and so forth.

Earlier on in the pandemic I had lamented the death of the verandah – as a in-between space where you could meet people who you didn’t want to invite into the fullness of the home. If and when I actually build a house (rather than buying one), I’ll possibly want both a verandah and a hallway.

I’m increasingly questioning why it became fashionable at all to have the main door of your house leading straight into the living room.

What is the Case Fatality Rate of Covid-19 in India?

The economist in me will give a very simple answer to that question – it depends. It depends on how long you think people will take from onset of the disease to die.

The modeller in me extended the argument that the economist in me made, and built a rather complicated model. This involved smoothing, assumptions on probability distributions, long mathematical derivations and (for good measure) regressions.. And out of all that came this graph, with the assumption that the average person who dies of covid-19 dies 20 days after the thing is detected.


Yes, there is a wide variation across the country. Given that the disease is the same and the treatment for most people diseased is pretty much the same (lots of rest, lots of water, etc), it is weird that the case fatality rate varies by so much across Indian states. There is only one explanation – assuming that deaths can’t be faked or miscounted (covid deaths attributed to other reasons or vice versa), the problem is in the “denominator” – the number of confirmed cases.

What the variation here tells us is that in states towards the top of this graph, we are likely not detecting most of the positive cases (serious cases will get themselves tested anyway, and get hospitalised, and perhaps die. It’s the less serious cases that can “slip”). Taking a state low down below in this graph as a “good tester” (say Andhra Pradesh), we can try and estimate what the extent of under-detection of cases in each state is.

Based on state-wise case tallies as of now (might be some error since some states might have reported today’s number and some mgiht not have), here are my predictions on how many actual number of confirmed cases there are per state, based on our calculations of case fatality rate.

Yeah, Maharashtra alone should have crossed a million caess based on the number of people who have died there!

Now let’s get to the maths. It’s messy. First we look at the number of confirmed cases per day and number of deaths per day per state (data from here). Then we smooth the data and take 7-day trailing moving averages. This is to get rid of any reporting pile-ups.

Now comes the probability assumption – we assume that a proportion p 
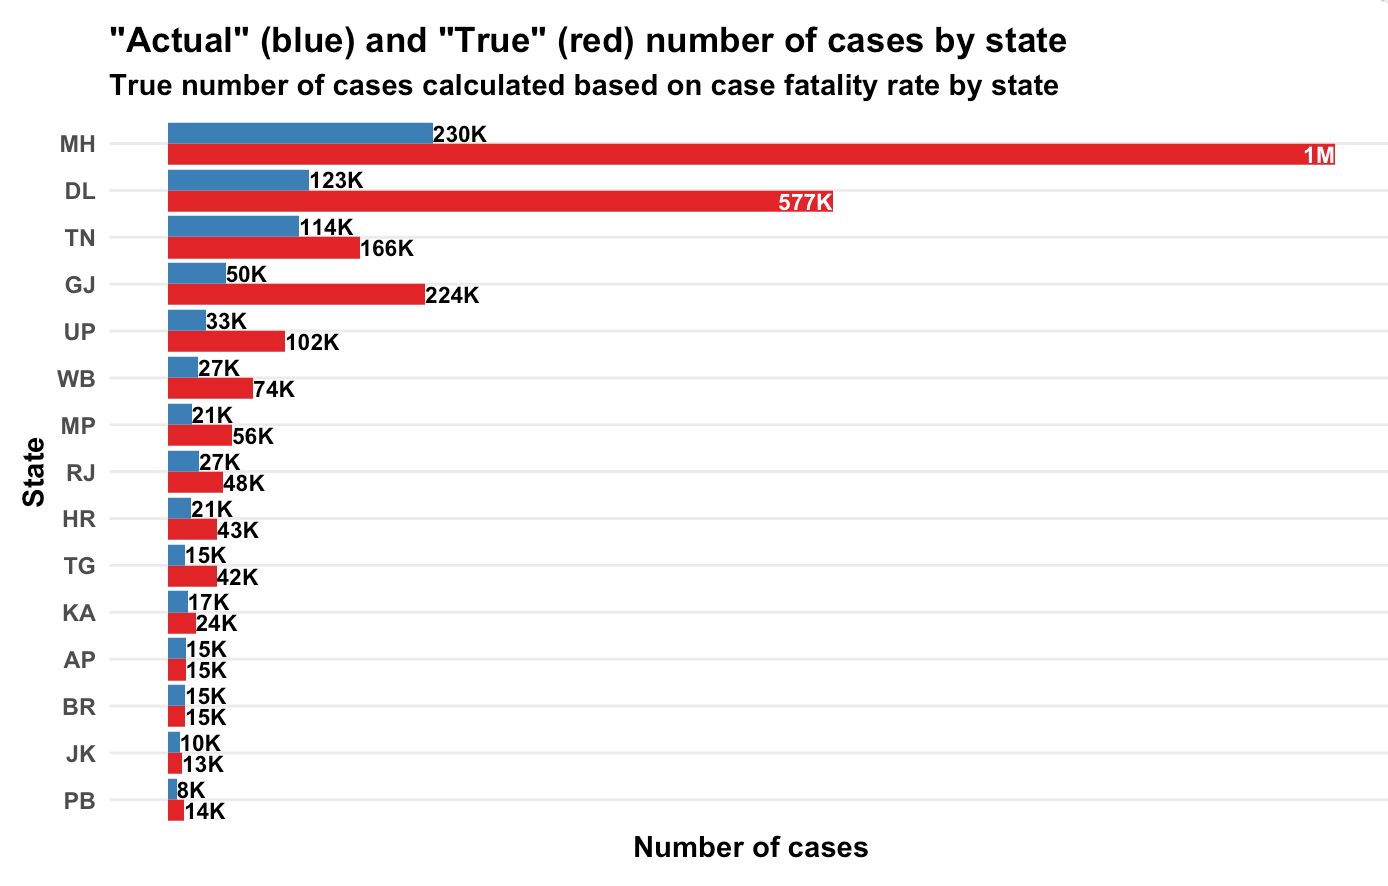
of all the confirmed cases will die. We assume an average number of days (N) to death for people who are supposed to die (let’s call them Romeos?). They all won’t pop off exactly N days after we detect their infection. Let’s say a proportion \lambda dies each day. Of everyone who is infected, supposed to die and not yet dead, a proportion \lambda will die each day.

My maths has become rather rusty over the years but a derivation I made shows that \lambda = \frac{1}{N}. So if people are supposed to die in an average of 20 days, \frac{1}{20} will die today, \frac{19}{20}\frac{1}{20} will die tomorrow. And so on.

So people who die today could be people who were detected with the infection yesterday, or the day before, or the day before day before (isn’t it weird that English doesn’t a word for this?) or … Now, based on how many cases were detected on each day, and our assumption of p (let’s assume a value first. We can derive it back later), we can know how many people who were found sick k days back are going to die today. Do this for all k, and you can model how many people will die today.

The equation will look something like this. Assume d_t is the number of people who die on day t and n_t is the number of cases confirmed on day t. We get

d_t = p  (\lambda n_{t-1} + (1-\lambda) \lambda n_{t-2} + (1-\lambda)^2 \lambda n_{t-3} + ... )

Now, all these ns are known. d_t is known. \lambda comes from our assumption of how long people will, on average, take to die once their infection has been detected. So in the above equation, everything except p is known.

And we have this data for multiple days. We know the left hand side. We know the value in brackets on the right hand side. All we need to do is to find p, which I did using a simple regression.

And I did this for each state – take the number of confirmed cases on each day, the number of deaths on each day and your assumption on average number of days after detection that a person dies. And you can calculate p, which is the case fatality rate. The true proportion of cases that are resulting in deaths.

This produced the first graph that I’ve presented above, for the assumption that a person, should he die, dies on an average 20 days after the infection is detected.

So what is India’s case fatality rate? While the first graph says it’s 5.8%, the variations by state suggest that it’s a mild case detection issue, so the true case fatality rate is likely far lower. From doing my daily updates on Twitter, I’ve come to trust Andhra Pradesh as a state that is testing well, so if we assume they’ve found all their active cases, we use that as a base and arrive at the second graph in terms of the true number of cases in each state.

PS: It’s common to just divide the number of deaths so far by number of cases so far, but that is an inaccurate measure, since it doesn’t take into account the vintage of cases. Dividing deaths by number of cases as of a fixed point of time in the past is also inaccurate since it doesn’t take into account randomness (on when a Romeo might die).

Anyway, here is my code, for what it’s worth.

deathRate <- function(covid, avgDays) {
covid %>%
mutate(Date=as.Date(Date, '%d-%b-%y')) %>%
gather(State, Number, -Date, -Status) %>%
spread(Status, Number) %>%
arrange(State, Date) -> 
cov1

# Need to smooth everything by 7 days 
cov1 %>%
arrange(State, Date) %>%
group_by(State) %>%
mutate(
TotalConfirmed=cumsum(Confirmed),
TotalDeceased=cumsum(Deceased),
ConfirmedMA=(TotalConfirmed-lag(TotalConfirmed, 7))/7,
DeceasedMA=(TotalDeceased-lag(TotalDeceased, 7))/ 7
) %>%
ungroup() %>%
filter(!is.na(ConfirmedMA)) %>%
select(State, Date, Deceased=DeceasedMA, Confirmed=ConfirmedMA) ->
cov2

cov2 %>%
select(DeathDate=Date, State, Deceased) %>%
inner_join(
cov2 %>%
select(ConfirmDate=Date, State, Confirmed) %>%
crossing(Delay=1:100) %>%
mutate(DeathDate=ConfirmDate+Delay), 
by = c("DeathDate", "State")
) %>%
filter(DeathDate > ConfirmDate) %>%
arrange(State, desc(DeathDate), desc(ConfirmDate)) %>%
mutate(
Lambda=1/avgDays,
Adjusted=Confirmed * Lambda * (1-Lambda)^(Delay-1)
) %>%
filter(Deceased > 0) %>%
group_by(State, DeathDate, Deceased) %>%
summarise(Adjusted=sum(Adjusted)) %>%
ungroup() %>%
lm(Deceased~Adjusted-1, data=.) %>%
summary() %>%
broom::tidy() %>%
select(estimate) %>%
first() %>%
return()
}

Verandahs

Both the houses that I grew up in (built in 1951 and 1984) had large verandahs through which we entered the house. Apart from being convenient parking spaces for shoes and bicycles (the purpose that the “hallway” in British homes also performs), these were also large enough to seat and greet guests that you weren’t particularly familiar with.

None of the other houses that I’ve lived in (as an adult, and most of them being apartments constructed in the last 20-30 years) have verandahs. Instead, you enter directly into the living room.

There might be multiple reasons for this. Like you don’t want to waste precious built up area on a separate room for guests that is likely to be sparingly used. Some people might consider a separate space to meet certain kinds of people who come home to be classist, and unbecoming of a modern home. Finally, over the last 20 years or so, not as many people come home as they used to earlier.

I’m completely making this up, but I think one reason that the number of people who come home is lower is that we now have more “third places” such as restaurants or bars or cafes to meet people. If you can meet your acquaintances for breakfast, or tea, or for a drink, there is less reason to call them home (or visit them). Instead, your home can be exclusive to people who you know very well and who you can invite into the fullness of your living room.

Now, I must confess that even before the covid-19 crisis, the wife and I had started missing a verandah, and have been furiously rearranging our large living-cum-dining room over the last year to create a “verandah like space”.

When government officials conducting the census come home, where do you make them sit? What about the painter or carpenter who has come to have a discussion about some work you want to get done? What about the guy from the bank who has come to get your signature on some random forms? Or the neighbour or relative who suddenly decides to pop in without being invited?

In either of the homes I grew up in, the verandah was the obvious place to seat and greet these people. You let people into your home, but not really. Now again, some people might think this is casteist or classist or whatever, but you don’t want to expose your private spaces to the world. With relatives and some acquaintances, though, it could get tricky, as seating someone in the verandah was too blatant an indication that they were not welcome, and could potentially cause offence.

In any case, the verandah was this nice middle place that was neither inside nor outside (Hiranyakashipu could have been killed in a verandah). Apart from seating the uninvited, verandahs meant that you could call acquaintances home, and the rest of the house could go on with its business completely ignoring that a guest had come.

In fact in my late teenage I had this sort of unspoken arrangement with my parents that I was free to call anyone home as long as I “entertained” them in the verandah. The family’s permission to invite someone would be necessary only if they were to come into the living room.

In any case, I think verandahs are going to make a comeback. As I wrote in my last post, the covid-19 crisis means that we are going to lose “third spaces” like restaurants or cafes or bars which were convenient places to meet people. And you don’t want to make a big deal of a formal invite home (including taking your family’s permission) to meet the sort of people you’ve been meeting on a regular basis in “third spaces”. A verandah would do nicely.

The only issue, of course, is that you can’t change the architecture of your home overnight, so verandahs may not make as quick a comeback as one would like. However, I think houses that are going to be constructed are going to start including a verandah once again (as well as a study). And people will start creating verandah-like spaces where they can.

One guy in my apartment works from home and gets lots of random visitors. He’s installed an artificial wall in his living room to simulate a verandah. Maybe that’s a sort of good intermediate solution?

The Prom

The other day, the wife and I were discussing about growing up, and about school crushes, and how relationships worked in school. It was a fascinating discussion, and it has already led to an excellent newsletter episode by her. Here is the key point of our discussion, as she wrote in her newsletter:

There are rumours that some boys have a crush on a couple of girls. You think that it’s a pandemic like the COVID-19, and it’s going to get us all, except it doesn’t. This unfortunately follows a power law, only a couple of boys and girls will be affected by the “crush”, the rest of us just have to be affected by the lack of – crushes, bosoms and baritones. Now, the problem with middle/ high school is that it operates on mob mentality – everyone is only allowed to have a crush on the crushable.

And then later on in the piece, she talks about proms.

You are most likely to fall in love organically and benefit from it early on in life. So, wasting these precious years of socialising is a sin.

So, when I think about it, “prom” is a great concept. It gives everyone a shot at gaining some experience. You’re better off going to prom at 16 rather than at 26.

This got me thinking about proms. I had no clue of the concept of a “prom” while growing up, and only came to know of it through some chick flicks I watched when I was in my late teens. However, I ended up writing about proms in my book (while describing Hall’s Marriage Theorem – yes, you can find Graph Theory concepts in a book on market design), and the more I think about it, the more I think it is a great concept.

The thing with proms is that it forces a matching. One on one. One boy gets one girl and vice versa (I really don’t know how schools that don’t have a balanced sex ratio handle it). And that is very different from how the crush network operates in middle and high school.

As Pinky described in her post, crushes in middle and high school follow a power law, because there is strong mob mentality that operates in early puberty. Before “benefits” get discovered, one of the main reasons for having a boyfriend/girlfriend is the social validation that comes along with it, and such validation is positive if and only if your peer group “approves” of your partner.

So this leads to a “rich get richer” kind of situation. Everyone wants to hit on the hottest boys and girls, with the result that a small minority are overwhelmed with attention, while the large majority remains partnerless. And they continue to be partnerless this way, friendzoning large sets of their classmates at an age that is possibly most suited for finding a long-term gene-propagating partner. 

In most Indian schools, the crush graph in high school looks like this. The boys and girls towards the bottom are the “long tail” – they are not cool to hit on, so nobody hits on them. In other words, they are unloved in High School. Notice that it’s a fairly long tail.

Also notice that most of the arrows point upwards (I’ve drawn the graph so the most sought-after people are on top). Because nothing prevents “one way crushes”, everyone just tries “as high as they can” to find a partner. And most of these don’t work out. And most people remain unloved.

So what does a prom do? Firstly, everyone wants to go to the prom, and to go to a prom, you need a date. Which means that everyone here in this long tail needs a partner as well. In the original setup, when crushes were based on mob-mentality, there was no concept of seeking “undervalued assets” (people nobody else is hitting on). Now, when everyone needs a unique partner, there is value to be found in undervalued assets.

Basically a prom, by providing immediate rewards for finding a partner (soon enough, the kids will discover other “benefits” as well), moves the schoolkids from a “crush network” to a “partner network”, which better represents real-world romantic networks.

Many people may not be able to pair with their first choice (notice in the above network that even the most sought after people may not necessarily match with their favourites), but everyone will get a partner. The Gale Shapley (or should I say Shapely Gal?) algorithm will ensure a stable matching.

Moreover, it doesn’t help your cause in getting a preferred (if not most preferred) partner for the prom if you make your attempt just before the prom. You need to have put in efforts before. This means that in anticipation of the prom, “pair bonding” can happen much earlier. Which means that schoolkids are able to get trained in finding a partner for themselves much earlier than they do now.

That will make it less likely that they’ll bug their parents a decade (or two) later to find them a partner.

RSVP

I’m reminded of this anecdote from class 11. A girl in my class had invited me to her birthday party. Knowing that there was a clash, I had immediately responded to her saying that I was sorry but I wouldn’t be able to make it. She immediately got offended – that I had told her directly that I wouldn’t come. She would possibly have been less offended had I told her I would come and then not showed up.

A lot of people in India don’t get the concept of how to reply to invitations. Like my old friend, these people think it’s a sort of insult to tell someone that they can’t make it for an event or a function. And so they end up giving false responses or non-responses which doesn’t leave the host any wiser. That leads to massively messed up planning, and possible wastage of food and gifts.

I must say I’ve been guilty of this in the past as well – maybe affected by that 11th standard incident, I have started giving non-committal responses to events that I know I won’t go to. And messed up my hosts’ planning. Having been on the other side multiple times in the last one month, however, I hereby undertake that I will give accurate responses to any invite I get, as far as things are under my control.

Over the last ten days, the wife had kept a massive doll display at home on the occasion of Dasara. We had made an elaborate plan of calling people from different “sides” on different days – in the interest of not mixing groups, which can have a massive negative effect on conversation.

And then some people threatened to destroy these carefully made plans by asking if they could come at a time when they were not invited! Some people were nice enough to tell us that the time when we had invited them was not convenient for them, and requested us right there to give them an alternate slot which we did. Others, however, responded in the affirmative, failed to show up and then wanted to come on a day when we weren’t prepared to receive guests (or worse, on days when were expected other guests from other “sides”).

The other side is also a bit painful here – when people give you an open invitation and tell you to “come any time”. While this gives you greater optionality than a specific slot, this also creates greater pressure on you to accept the invitation. And I’m guilty of responding vaguely to some of these invitations as well. Next time someone gives me an open invite, I will either say no, or try to tell them as soon as possible a specific date and time when I’ll be there.

PS: Of late I’ve started becoming actively (but subconsciously) rude to people who show up at my door unannounced. It throws me off massively. Sometimes my wife wonders why I bothered coming back from England at all!


The Indian Second Wave

Most obituaries will describe the just-deceased VG Siddhartha as a businessman, a “coffee tycoon” and as the son-in-law of a prominent politician. However, the way I see it, he was no less than a cultural icon, and with one business, dramatically changed Indian culture in two ways.

In 1996, Siddhartha started India’s first cyber cafe, which was one of the few cyber cafes that was actually a cafe. A coffee wholesale exporter, he got into the retail business with the first outlet of Cafe Coffee Day (CCD) on Bangalore’s busy Brigade Road. For fees, you could sit there to browse the internet while sipping on espresso and cappuccino, drinks hitherto unknown to Bangalore’s (already established) coffee culture.

Soon enough he was to exit the cyber side of the business, as his retail chain’s expansion focussed on coffee, and dedicated “cyber cafes” (they were still called that) that enabled people to browse the internet for a fee mushroomed across the country. Nevertheless, we should give him credit for giving birth to an idea that enabled the first generation of Indians to truly access the internet before broadband became a thing.

The first time I interacted with his business was in 1998, when I visited the aforementioned Brigade Road CCD. For a conservative 15-year-old from South Bangalore, it was a bit of a sticker shock, with espresso priced at Rs. 10 and cappuccino at Rs. 20. There were iced drinks on the menu as well, but they were more expensive.

I don’t think I quite liked the espresso (we all ordered that that day, given the prices), but it was a new experience of consuming coffee. As I grew up and came into more money I would patronise CCD much more often.

There was an outlet on the IIMB campus, and that became the default location for any campus “treats”. I clearly remember the cold drinks – tropical iceberg and cold sparkle – being priced at Rs. 32 back in 2004. Prices went up over time but these drinks remain my favourite cold drinks at CCD to this day.

Over the last 10 years, CCD has mostly served as a meeting room for me. When I moved into my current house 5 years ago, I used a CCD that was 300 metres away to entertain any visitors (this outlet closed recently, but a flyer in today’s newspaper informs me that an “experience centre” is coming up closer by).

Whenever I have had to meet someone and we’ve had to find a place to meet, by default we have looked for CCD outlets. And we continue to do so – while Starbucks and the artisanal “Aussie-style” coffee shops (such as Third Wave or Blue Tokai) might be preferable, CCD’s sheer density has meant that it is India’s default meeting room.

Sometimes we under-appreciate the impact that CCD has had in Indian culture. It was perhaps the first large chain of “neutral venues”, where people could meet and hang out for a long time without being pestered by the waiters. I mentioned that I have been using the chain as a meeting room for a few years now. While that might be its primary use, you also find college kids who have saved up a bit on their pocket money hanging out there. My first date with my wife also took place partly at a CCD.

And then there are the loos. CCD has also completely altered the face of highways in India by offering clean loos at its outlets, making it far easier for women to travel.

The chain may not be doing that well – it seems like its financial troubles led to Siddhartha killing himself. However, given that it is a publicly traded company, we can trust the market to resolve its issues so that it continues.

And even if it fails and has to shut shop in due course, what CCD has done is to show that there is a viable market in India for a coffee shop that sells decent (but not great) coffee, where people can sit around and linger and do their business, whatever that may be.

In that way, Siddhartha’s legacy will endure.


Government and markets

It’s been a while since I wrote a post like this one – I remember a decade ago, I used to flood my blog with such stuff.

In any case, last week, in response to the “10yearchallenge” meme, Nitin Pai of Takshashila wrote an Op-Ed in the Print on how India has changed in 10 years. While he admits that the country has grown and the lives of people has improved in some ways, the article leads with the headline that India should be be ashamed of what has happened in the last 10 years. This paragraph is possibly representative of the article:

While individual Indians seem to have done well over the past decade, India is more or less where it was. Worse, politics and policy priorities seem to have regressed to 1989.

Reading through the article (I encourage you to read it, it’s good – never mind the headline), I found a clear and distinct pattern in the kind of things where things have gotten better in India and where things have gotten worse.

Everything where markets function, or where the government doesn’t have much of a role, things have changed significantly for the better. Everything where the government has an outsized role, either because it is the government’s job or the sector is overregulated, things have gotten worse. So our cities have gotten more crowded. Infrastructure has gotten worse. Law and order has regressed. And this has had little to do with the party in power – whatever the government touched has regressed.

Looking at it in another way, Indians seem to be highly capable of making their lives better by coordinating using the invisible hand of the market. However, we seem incapable of making our lives better by coordinating using the government process.

From this perspective, there is one easy way to progress – basically reduce the government. Get rid of the overregulations. Get the government out of things where it shouldn’t be. Give a freer hand to the market.

Unfortunately, ahead of general elections this year, we see most parties taking a highly statist line. This is a real tragedy.