The problem with venture capital investments 

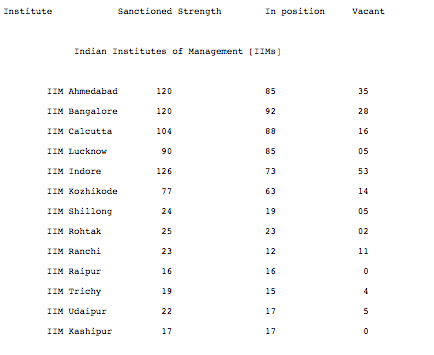
Recently I read this book called Chaos Monkeys which is about a former Goldman Sachs guy who first worked for a startup, then started up himself, sold his startup and worked for Facebook for a number of years. 

It’s a fast racy read (I finished the 500 page book in a week) full of gossip, though now I remember little of the gossip. The book is also peppered with facts and wisdom about the venture capital and startup industries and that’s what this blogpost is about. 

One of the interesting points mentioned in the book is that venture capitalists do not churn their money. So for example if they’ve raised a round of money, some of which they’ve invested, liquidating some of the investment doesn’t mean that they’ll redeploy these funds.

While the reason for this lack of churn is not known, one of the consequences is that the internal rate of return (IRR) of the investment doesn’t matter as much as the absolute returns they make on the investment during the course of the round. So they’d rather let an investment return them 50x in 8 years (IRR of 63%) rather than cash it one year in for a 10x return (IRR of 900%). 

Some of this non churn is driven by lack of opportunities for further investment (it’s an illiquid market) and also because of venture capitalists’ views on the optimal period of investment (roughly matching the tenure of the rounds). 

This got me thinking about why venture capitalists raise money in rounds, rather than allowing investors continuous entry and exit like hedge funds do. And the answer again is quite simple – it is rather straightforward for a hedge fund to mark their investments to market on a regular basis. Most hedge fund investment happens in instruments where price discovery happens at least once in a few days, which allows this mark to market. 

Venture capital investments however are in instruments that trade much more rarely – like once every few months if the investor is lucky. Also, there are different “series” of preferred stock, which makes the market further less liquid. And this makes it impossible for them to mark to market even once a month, or once a quarter. Hence continuous investment and redemption is not an option! Hence they raise and deploy their capital in rounds. 

So, coming back, venture capitalists like to invest for a duration similar to that of the fund they’ve raised, and they don’t churn their money, and so their preferences in terms of investment should be looked at from this angle. 

They want to invest in companies that have a great chance of producing a spectacular return in the time period that runs parallel to their round. This means long term growth wise steady businesses are out of the picture. As are small opportunities which may return great returns over a short period of time.

And with most venture capitalists raising money for similar tenures (it not, that market fragments and becomes illiquid), and with tenure of round dictating investment philosophy, is there any surprise that all venture capitalists think alike? 

Batch size at IIMB

A few days back I had written about how the new IIMs with a sanctioned batch size of around 60 and a faculty strength of 20 are unviable and need to scale up quickly. My argument was that one of the big strengths of the older IIMs is its faculty size which leads to a large number of electives, which allows students to shape themselves the way they best feel. In this context it would be interesting to compare these IIMs to one or more of the older IIMs.

I recently received a mail by the IIMB Alumni Association asking me to reach out to batchmates who are not part of the association. This mail had been sent to all IIMB Alumni who are registered with the association, and the purpose was to increase membership and reach of the association (and no, there are no membership fees). And the mail came with a very interesting data set, and one of the fields was the size of each graduating batch at IIMB.

Source: IIMB Alumni Association

It can be seen that IIMB also started rather small, with about 50 students graduating in the first batch in 1976. By the end of the decade, the number was close to a 100, which is where it stayed through the 1980s. Around 1990 was when the batch size increased to about 150, and the number stayed within the 150-200 range for another decade and a half (the 2004 batch was bigger than the ones around it, possibly due to the IT slowdown in 2002 when this batch entered IIM).

And then after 2006 (when I graduated), the batch size increased. My batch had three sections as would have the 15 batches prior to that (based on this data; IIM sections normally consist of 60-70 students). In fact, the “quantum” nature of the increase in batch size at IIM can be put down to the concept of sections – so the increase from the 100 to 150 level was a function of addition of a third section, and so on. After 2006, though, the batch size has exploded, and the current batch (2013-15, who I’m teaching) has a strength of almost 400 students (divided into six sections).

A good addition to this dataset would be some data that could show the prominence or measure of success of IIMB Alumni who graduated in each  batch, which can then allow us to examine whether batch size has had anything to do with continued career success of the students. It would be interesting to examine how this additional data can be collected.

Environmentalism and the Discount Rate

Alex Epstein, in his new book “The Moral Case for Fossil Fuels” has a fantastic quote (HT: Bryan Caplan). Epstein writes:

It is only thanks to cheap, plentiful, reliable energy that we live in an environment where the water we drink and the food we eat will not make us sick and where we can cope with the often hostile climate of Mother Nature. Energy is what we need to build sturdy homes, to purify water, to produce huge amounts of fresh food, to generate heat and air-conditioning, to irrigate deserts, to dry malaria-infested swamps, to build hospitals, and to manufacture pharmaceuticals, among many other things. And those of us who enjoy exploring the rest of nature should never forget that energy is what enables us to explore to our heart’s content, which preindustrial people didn’t have the time, wealth, energy, or technology to do.

Or, as Caplan puts it in his annotation,

Epstein’s second key claim is normative: Human well-being is the one fundamentally morally valuable thing.  Unspoiled nature is only great insofar as mankind enjoys it:

This allows us to characterise environmentalism and other conservationist movements through one simple factor – the Discount Rate. Let me explain.

Essentially, let us assume that we are optimising for aggregate human well-being. So we are optimising for the aggregate of the well-being of all humans today, all humans tomorrow, 10 years from now, 100 years from now and so forth. Now, if we try to optimise for short term well-being beyond a point (extracting too much oil, for example, or burning too much fossil fuel or cutting down too many trees), the well-being of future generations gets affected in a negative manner. If we are more conservative (and conservationist) now, future generations will get to enjoy greater well-being.

So, looking at the problem from the assumption that we want to “maximise aggregate human well-being”, the problem boils down to one “simple” tradeoff between well-being of human beings today and well-being of human beings at a later point in time. And it is precisely for answering questions on such inter-temporal tradeoffs that the world of economics and finance introduced the concept of a “discount rate”!

Finance assumes that rational human beings like to consume today compared to tomorrow, but only up to a point – you don’t want to consume so much today that there is nothing left to consume tomorrow. This leads us to indifference curves between today’s and tomorrow’s consumption, and if we add to this the resource constraint, we get the “discount rate” (the actual derivation is beyond the scope of this blog post).

The discount rate essentially gives us a tool to compare consumption today to consumption at a point of time in the future and make a decision on which one is more valuable. The higher the discount rate, the greater importance we give today’s consumption vis-a-vis tomorrow’s. A lower discount rate gives greater weight to tomorrow’s consumption compared to today’s.

So coming back to conservationism, the question finally boils down to “what is our discount rate”, or to track back one step “how do we value today’s well-being vis-a-vis well being at a point of time in the future”. If you assume a high discount rate, that means you give more importance to today’s well-being. A discount rate of zero gives equal importance of well-being today compared to well-being a few generations down the line. The discount rate in this case can even be negative – where you give greater importance to the well-being of humans of a future generation than to current well-being!

So the debate on fossil fuel consumption and carbon emissions and suchlike can be characterised by this one factor – what is our discount rate? And it is a disagreement on this that leads to most debates on this topic. Conservationists usually have a very low (or even negative discount rate), and they tend to play up the risks to well-being of future generation humans. The opposite side works with a much higher discount rate and argues that we should not ignore the well-being of current generations vis-a-vis the future. And the battle rages on.

Targeting government transfers

Bryan Caplan, quoting from Greg Mankiw, puts out some very interesting numbers on government transfers to households in the United States.

Source: Econlog

As Caplan puts it, this table shows a pattern “neither liberals nor conservatives will expect”. Some points to be noted:

1. government transfers per household to the top quintile is much more than to the bottom quintile. While the former pay taxes and the latter don’t, this is simply bizarre and shows how ill-targeted transfers in the US are

2. The bottom 60% of households in the United States pays negative tax! The “middle quintile” pays taxes but gets transfers from the government of twice the amount.

3. The net taxes paid by the 4th quintile is negligible ($700 per household). So effectively in the US, only the top 20% pays tax.

I wonder if it is possible to get such data for India, and if we can, what it will look like. If we manage to tack on all subsidies to the “transfers” thing (food, fuel, etc.) it should present a very interesting picture. My guess is that the “effective tax base” in India will be much lower than that of the US.

Any data sources that can help us construct one such table for India?

Uber and the narrative bias

Following the alleged rape of a Delhi woman by a cab driver who she’d engaged via the Uber app, the Delhi government has banned Uber. Union home minister rajnath Singh has issued a notification to other state governments to do the same though union transport minister Nitin Gadkari has rightly called it a silly idea.

Irrespective of whether the service gets banned, fewer people are likely to use it. A survey conducted by Mint newspaper has shown that nearly half the people surveyed will not use an Uber following the incident (the survey doesn’t mention how many of those surveyed are existing users of Uber).

About a year back, two buses of the Volvo make (one travelling from Bangalore to Hyderabad and the other from Bangalore to Pune) caught fire, resulting in passenger deaths. While the government of Karnataka mercifully didn’t ban Volvo buses (instead simply subjecting them to safety checks and insisting on emergency exits), there was a large backlash from the public who eschewed travel by Volvos in favour of travel by other means of transport.

In 2001, following the 9/11 attacks, Americans eschewed air travel in favour of driving. Gerd Gigerenzer, a specialist in risk, has estimated that 1595 additional people died in the year following 9/11 on account of driving rather than taking flights.

The question that arises is what those current users of Uber who don’t want to use the service any more are going to do – surely they must resort to alternate means of transport to commute? The question they need to ask themselves is If the new chosen means of transport is safer than Uber!

People abandoning Uber in droves following last weekend’s incident is due to what I can the “narrative bias”. Last weekend’s incident has introduced the narrative that Uber is not necessarily safe – at least it is not as safe as people assumed it to be prior to the incident. And this narrative is likely to lead to people reacting, and in a direction that is not necessarily better for them!

So if people abandon Uber, or if it gets banned (the proposal is to ban other app based cab services too ), what is the alternative, and is it safer than Uber? Extremely unlikely, If the answer is auto rickshaws for example. We might as well end up in a situation like what happened on the highways in the US after 9/11.

News by definition is spectacular and spectacular incidents are much more likely to be reported than unspectacular ones (a favourite example I use is – how many times do we see a headline that says ” Ashok Leyland bus catches fire. Passengers dead “? The fact that we seldom see such headlines doesn’t mean that Ashok Leyland buses never catch fire). This, however, doesn’t mean that policymaking, too, be based on spectacular events only.

Any regulation, and decisions by people, should be based on rational expectations and not be biased by narratives and the spectacular. There is always pressure on the policymaker to ” do something “. This however doesn’t mean that anything will do. Decisions need to be based on reason and not narratives!

PostScript: I’ve written this post sitting in the back of an Uber taxi in Bangalore

Educating at scale

You can’t run a high-quality business school with 20 faculty members

In the course of a twitter discussion yesterday, journalist Mathang Seshagiri quoted numbers from a parliamentary reply by the ministry of HRD (on the 24th of November 2014) on the sanctioned faculty strength and vacancies in “institutes of national importance”. While his purpose was to primarily show that even the older IITs and IIMs have massive vacancies, what struck me was the sanctioned faculty strength of the newer IIMs. Here is the picture posted by Mathang:

Source: Parliamentary Proceedings (Rajya Sabha). November 24th 2014. Reply by MHRD

Look at the second column which shows the sanctioned faculty strength in each IIM. Once you go beyond the six older IIMs, the drop is stark. The seven newer IIMs have a sanctioned faculty strength of about 20! The question is how one can run a business school with such a small faculty base.

About ten years back, when I was a student at IIM Bangalore, I had gone for an event where I met someone from another business school in Bangalore whose name I can’t remember now. During the course of the conversation he asked me how many electives he had. I replied that we had about 80-100 courses from which we had to pick about 15. This he found shocking for in his college (from what I remember) there were only three or four electives!

The purpose of an MBA is to provide broad-based education and broaden one’s horizons. Thus, after a set of core courses in the first year (usually about fifteen courses), one is exposed to a wide variety of electives in the second year. It is a standard practice among most top B-schools to fill the entire second year with electives. In fact, in IIM Bangalore, electives start towards the end of the first year itself.

With 20 faculty members, there are only so many electives that can be offered each year. For example, in the coming trimester, IIM Bangalore is offering students (about 400 in the batch) a choice of about 40-50 electives, of which each student can pick four to six. This gives students massive choice, and a good chance to tailor the second year of their MBA and mould themselves as per their requirements.

By having 20 faculty members, the number of electives that can be theoretically offered itself is smaller (given research requirements, most IIM professors have a requirement to teach no more than three courses a year, and they have core and graduate courses to teach, too), which gives students an extremely tiny bouquet of choices – if there is any choice at all. This significantly limits the scope of what a student in such a school can do. And the student has no option but to accept the straitjacket offered by the lack of choice in the school.

In the ensuing twitter conversation this morning, Mathang contended that it is okay to have a faculty strength of 20 in schools with 60 students per batch. While this points to an extremely healthy faculty-student ratio, the point is that for broad-based education such as MBA, faculty-student ratio is not a good metric. What makes sense is the choice that the student is offered and that comes only at scale.

Thus, the new IIMs (Shillong “onwards”) are flawed in their fundamental design. It is impossible to run a quality business school with only 20 faculty. One way to supplement this is by using visiting faculty and guest lectures, but some of the new IIMs are located in such obscure places (where there is little local business, and which are not easily accessible by flight) that this is also not an option.

Merging some of these smaller IIMs (a very hard decision politically) might be the only way to make them work.

PS: Here is the sanctioned faculty strength and actual faculty strength numbers for IITs (same source as above). I might comment upon that at a later date.

Source: Parliamentary reply by Ministry of HRD; November 24th 2014

Certainty in monetary policy

Two big takeaways from today’s monetary policy review are the institution of a formal inflation target and a commitment to consistency in monetary policy

I found two major takeaways from RBI Governor Raghuram Rajan’s press conference this morning following the RBI policy review (where both the policy rate and the cash reserve ratio were held constant).

Firstly, Rajan used this opportunity to set for the bank a long-term inflation target. In a previous review, it had been announced that the RBI was focussed on targeting a 6% inflation rate by January 2016, and that conversations were on between the RBI and the Government regarding setting a formal inflation target.

In today’s review, Rajan took this one step further announcing that after January 2016, the RBI will set its policy rate targeting an inflation rate of 4% +/- 2%. This is extremely significant for for the first time it signifies a primarily inflation-targeting objective for the Reserve Bank of India. Over the last few months Rajan has made several attempts to explain that low and stable inflation is a necessary condition for a high and stable growth rate, and having primed us with this narrative, he has finally committed to a long-term inflation target.

The second important takeaway was the emphasis on consistency in policy. Rajan mentioned that while he is prepared to cut rates when the conditions are ripe, what he doesn’t want to do is to flip-flop on rates. This means he is likely to cut rates in this policy review only if he is confident that the requirement of having to raise rates in the next policy review is going to be low. This is extremely significant, as this kind of a direction is an implicit commitment to both savers and borrowers that they can expect the same direction for a significant amount of time, which means that they can plan better.

While some commentators might be disappointed that rates were not cut today, I think today’s policy review was extremely fruitful and some of the commitments made will have important consequences in the long run. Consistency in policy is an extremely important step, and the adoption of a formal inflation target at a time when global oil and food prices are dropping is excellent timing.

The press conference itself was quite insightful, and the way Rajan and his deputies handled the questions was extremely instructive. For example, one journalist mentioned that we’ve already hit 6% inflation which was the target for January 2016, and asked why rates weren’t cut on that account. Rajan replied that the fact that inflation is 6% today doesn’t imply that it will stay there a year later, and we need to work towards holding it there, and that the holding of rates in today’s review was a step in that direction.

How “non-vegetarian” is India?

Last week, after Master Chef India announced that the next season is going to be all-vegetarian, there was considerable outrage on social media. Most of the outrage contended that this was a result of the Hindu right dominating the narrative, and quoted studies that said that over 80% of India eats meat. It didn’t help that sponsors of Masterchef this season are Amul (the milk cooperative) and the Adani group, which is known to be close to the Prime Minister.

In this context, this chart from the Washington Post is quite instructive. The chart indicates the per capita per year consumption of various meats across different countries. It takes a lot of effort to find India in this chart, since it is almost non-existent. This chart shows how little meat per capita is actually consumed in India.

source: http://www.washingtonpost.com/blogs/wonkblog/wp/2014/07/14/the-coming-global-domination-of-chicken/

While it might be true that 80% of India’s population is not averse to eating meat, the actual fact on the ground is that very little meat is actually consumed. Which makes is okay to term India as a largely vegetarian country.

Whether that should necessitate a vegetarian-only cookery show on TV, though, is another matter and one that this blog has no opinion on.

Currency confusion

Arvind Panagariya has an excellent piece in the Business Standard on how “tax terrorism” has created a poor investment atmosphere, and if not reversed quickly, might be the undoing of the “Make In India” campaign. While the piece itself is brilliant, my problem with it is that it mixes currencies and numbering systems without providing “translations”. Sample these two extracts:

In 2013, Nokia decided to exit mobile and smartphone manufacturing and sold its worldwide operations to Microsoft. Around the same time, the income tax department retrospectively assessed a sum of Rs 15,258 crore in tax liability against Nokia, India and placed a lien on its Chennai operations.

and

But in our zeal to immediately generate a large volume of revenues, we have compromised that prospect. Ironically, in doing so, we may not have added much to our revenue kitty either. Already, the tax authorities have lost a $3 billion tax claim against Shell in the Bombay High Court.

Now, $3 billion is approximately equal to Rs 18,000 Crores, which makes the size of Shell’s tax dispute to be of the same order of magnitude as Nokia’s. However, being presented in different currencies (the Nokia number is mentioned up to five significant digits, for no good reason), it makes it hard for the reader to compare the two numbers and appreciate their similarity!

Unrelated to this piece but another similar problem in reporting in Indian newspapers is the confusion of Indian and Western systems of representing large numbers. Some numbers are represented in lakhs and crores, and others in millions and billions, and while the two might be in the same “units”, it is still an effort on behalf of the reader to appreciate.

It would be a great idea for newspapers to put down as part of their editorial policies a note on expressing all numbers in a given piece in the same units and numbering systems (providing translations where said units or systems are not “native” to the data being presented). This will go a long way in helping readers appreciate the numbers.

Tailpiece: I read the first part of this piece assuming that it had been written by Arvind Subramanian (Chief Economic Adviser to MoF) and was quite surprised at the candour expressed by a member of the government. Evidently, I’m not the only person to have got confused between these two Arvinds.

Baumol Disease Index

In his excellent take on why Rohit Sharma’s 264 is bad for cricket, Niranjan Rajadhyaksha writes about the Baumol’s Cost Disease. This phenomenon, which was first described by William Baumol and William Bowen in the 1960s, describes the increase in cost of labour in industries that have seen little productivity. This has to do with an increase in productivity in other sectors which pushes up the clearing price of labour, which increases the costs of industries that have seen no improvements in productivity.

Based on this, we can construct an index on how industrialised an economy is, which I’m going to christen “Baumol Disease Index”. The basic idea is to pick a sector that is likely to be unaffected by productivity changes over the long term, and look at the median salary of workers in that sector in different countries and across different points in time. This can help us compare the relative levels of industrialisation and productivity in different countries, and in the same country over time.

In order to construct this index, we will take into account one sector which has a lot of “human input” and is unlikely to see much improvement in productivity thanks to mechanisation. My first choice for this was for employees of a company like McDonalds (taking off on The Economist’s Big Mac Index) but then that sector is not that insulated from greater productivity.

We could use the original example that Baumol and Bowen used, which is performing arts, but then performing arts is a winner takes all market – Iron Maiden will be able to command much higher ticket prices compared to the local orchestra thanks to their history and brand and perception of quality. So performing arts is not a great example, either.

Another good choice would be government bureaucrats, since their work is unlikely to be much affected by productivity. But then we’ve had some computerisation and that must have increased some productivity, and ability to be productive and willingness to be productive don’t always go hand in hand!

What about drivers? Despite the efforts towards development of driverless cars, these are unlikely to really take off in the next couple of decades or so, and so we can assume that productivity will remain broadly constant. The other advantage of drivers is that while salaries are tricky to measure (and we need to depend on surveys for those, with mostly unreliable results), taxi fares in different cities are public information, and it is not hard to separate such fares out into cost of fuel, cost of car and cost of driver’s time. This way, measurement of an average taxi driver’s income in different cities and countries, and at different points in time, should not be really difficult.

So, I hereby propose the Baumol Disease Index. It is the per month pre-tax expected income for a driver in a particular city after taking into account costs of fuel and car. This number is going to be imputed from taxi prices. And is going to be a measure of general levels of productivity and industrialisation in an economy. Sounds good?

And while we are on the topic of indices, you should read this excellent leader in last week’s The Economist on the profusion of indices. And since we have a profusion anyway, adding this one additional index shouldn’t hurt! And this one (Baumol Disease Index) measures something that is not measured by too many other indices, and is simple to calculate!

Howzzat?