Simpson’s Paradox for Levitt’s Measure

Some of you might know that I do this daily covid-19 update on twitter (not linking since I delete each day’s posts the next morning). A couple of weeks back I revamped it, in advance of which I asked what people wanted to see.

A lot of people suggested I use “Levitt’s metric”. I ignored it. Then, after I had revamped the output last week, two people I know very well got in touch asking me to report that metric every morning in my update. This time I decided to do it, and added it to my update on Monday.

My daily update has the smoothed line using a loess smoothing, but I also wanted to see if I can “predict” when the pandemic might end in different places. And so I did a linear fit as well (using 1 month of data – the slope of the line is highly sensitive to how far back you go), and posted it on Twitter.

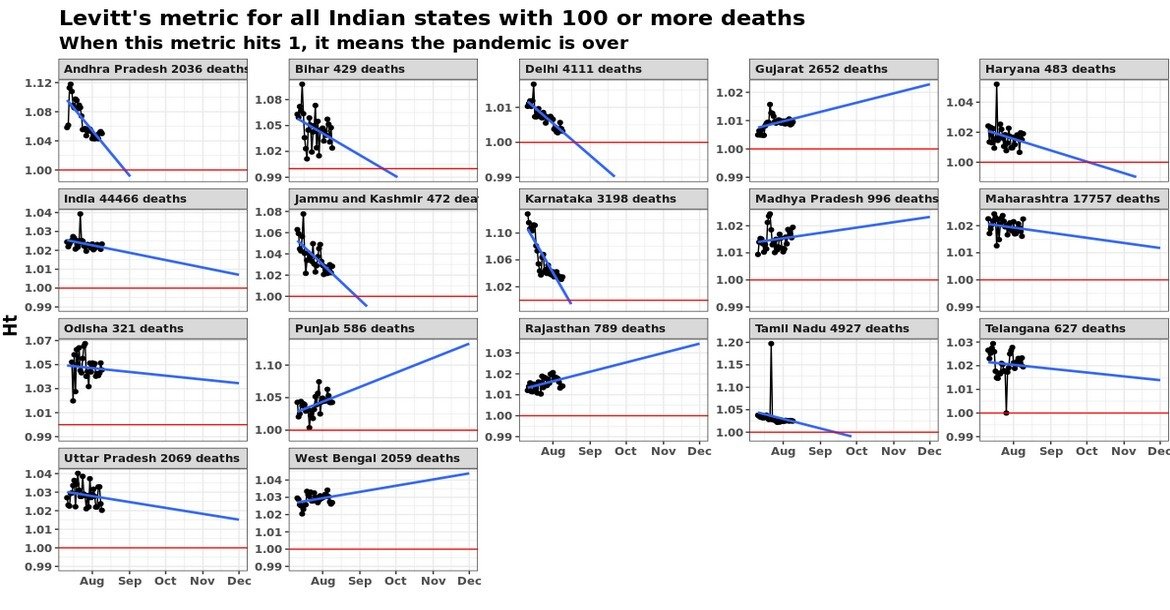
I’ve extended the X axis of the graph until the end of the year. The idea is that when the blue line (the regression line based on the last 30 data points) hits the red line, the pandemic in that place is “effectively over”. So we can predict when the pandemic might end in different places.

Now, if you slightly contort your neck and try and extend the “india” graph here rightwards, you might see that the pandemic might end (for all practical purposes) around February. The funny thing is that while on average the pandemic might end in India in February, we see that for specific regions the slope is actually increasing (which suggests the pandemic might never end).

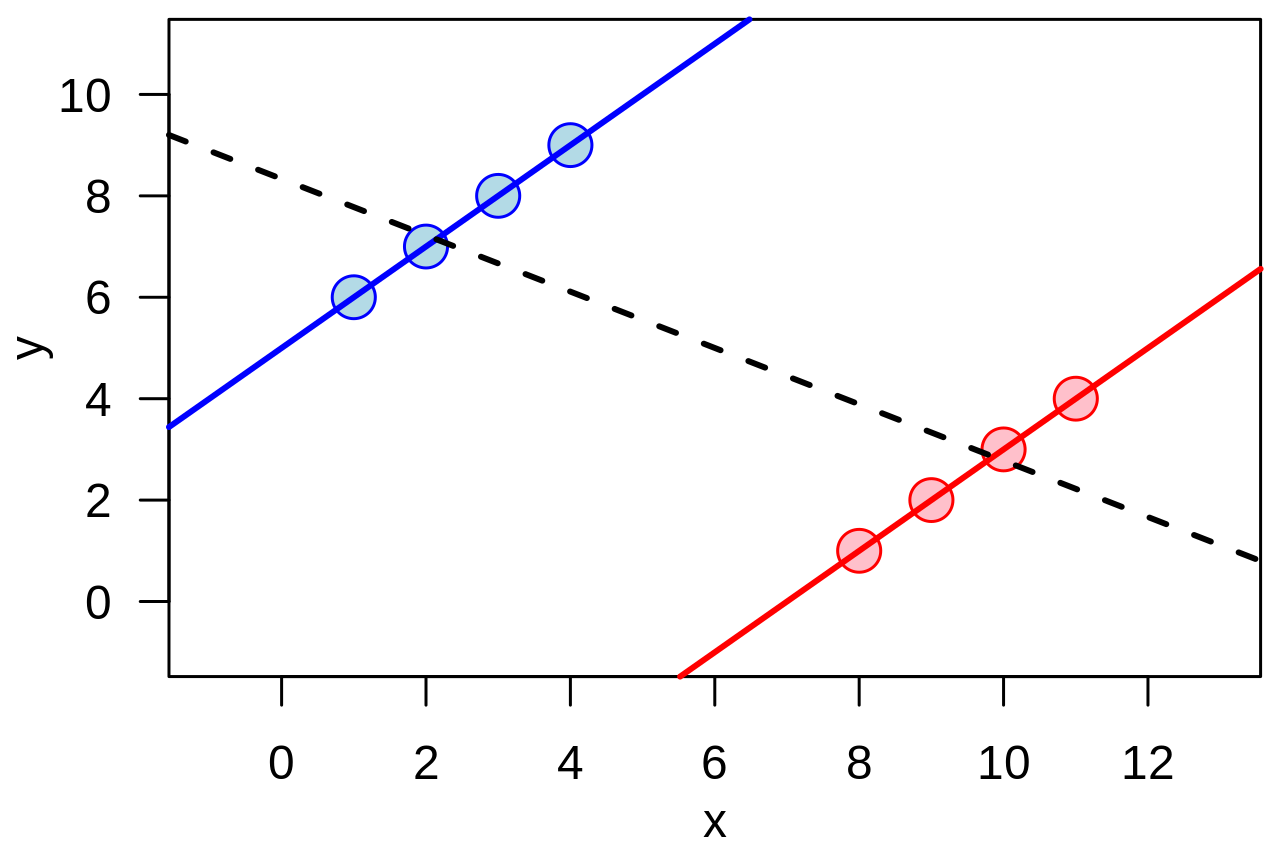
And this creates confusion. When you have a bunch of regions with upward slopes, and then suddenly for the aggregate (India) it is a downward slope, it doesn’t make intuitive sense. It is similar to Simpson’s paradox, where a trend disappears when you aggregate data. This graph possibly represents the most famous example of Simpson’s paradox.

Back to the Levitt’s metric, my only explanation is that the curve can’t be infinitely upward sloping – the number of people in any place is finite and so the disease is bound to die out some time or the other. The upward sloping lines are only a figment of the arbitrary linear extrapolation, and are likely to turn down sooner rather than later.

Telling stories with data

I’m about 20% through with The Verdict by Prannoy Roy and Dorab Sopariwala. It’s a fascinating book, except for one annoyance – it is full of tables that serve no purpose but to break the flow of text.

I must mention that I’m reading the book on the Kindle, which means that the tables can pose a major annoyance. Text breaks off midway through one page, and the next couple of pages involve a table or two, with several lines of text explaining what’s in the table. And then the text continues. It makes for a rather disruptive reading experience. And some of the tables have just one data point – making one wonder why it has been inserted there at all.

This is not the first book that I’ve noticed that makes this mistake. Some of the sports analytics books I’ve read in recent times, such as The Numbers Game also make the same error (I read that in print, and still had the same disruption). Bhagwati and Panagariya’s Why Growth Matters is similarly unreadable. Tables abruptly inserted into the middle of text, leading to the reader losing flow in the reading.

Telling a data story in book length is a completely different challenge to telling one in article length. And telling a story with data is a complete art form. When you’re putting a table there, you need to be able to explain why that table is important to the story – rather than putting it there just because it seems more rigorous.

Also the exact placement of the table (something that can’t be controlled well in Kindle, but is easy to fix in either HTML or print) matters –  the table should be relevant to the piece of text immediately preceding and succeeding it, in a way that it doesn’t disrupt the reader’s flow. More importantly, the table should be able to add value at that particular point – perhaps building on something that has been described in the previous paragraph.

Book length makes it harder because people don’t normally expect tables and figures to disturb their reading flow when reading something of book length. Also, the book format means that it is not always possible to insert a table at a precise point (even in print, where pagination is an issue).

So how do you tell a book length story with data? Firstly, be very stingy about the data that you want to show – anything that doesn’t immediately add value should be banished to the appendix. Even the rigour, which academics might be particular about, can be pushed to the end notes (not footnotes, since those can be disruptive to flow as well, turning pages into half pages).

Then, once you know that showing a particular table or graph is inevitable to telling the story, put it either in the beginning or the end of a chapter. This way, it doesn’t break the reader’s flow. Then, refer to individual numbers in the middle of the text without having to put the entire table in there. Unless each and every data point in the table is important, banish it to the endnotes.

One other common mistake (I did it in my piece in Forbes published yesterday) is to put a big table and not talk about it. It only seeks to confuse the reader, who starts looking for explanations for everything in the table in later parts.

I guess authors and analysts tend to get possessive. If you have worked hard to produce insights from data, you seek to share as much of it as possible. And this can mean simply dumping data all the data in the piece without a regard for what the reader will do with it.

I’m making a note to myself to not repeat this mistake in future.

Data Science and Software Engineering

I’m a data scientist. I’m good with numbers, and handling large and medium sized data sets (that doesn’t mean I’m bad at handling small data sets, of course). The work-related thing that gives me most kicks is to take a bunch of data and through a process of simple analysis, extract information out of it. To twist and turn the data, or to use management jargon “slice and dice”, and see things that aren’t visible to too many people. To formulate hypotheses, and use data to prove or disprove them. To represent data in simple but intuitive formats (i.e. graphs) so as to convey the information I want to convey.

I can count my last three jobs (including my current one) as being results of my quest to become better at data science and modeling. Unfortunately, none of these jobs have turned out particularly well (this includes my current one). The problem has been that in all these jobs, data science has been tightly coupled with software engineering, and I suck at software engineering.

Let me stop for a moment and tell you that I don’t mind programming. In fact, I love programming. I love writing code that makes my job easier, and automates things, and gives me data in formats that I desire. But I hate software engineering. Of writing code within a particular system, or framework. Or adhering to standards that someone else sets for “good code”. Of following processes and making my code usable by some dumbfuck somewhere else who wouldn’t get it if I wrote it the way I wanted. As I’d mentioned earlier, I like coding for myself. I don’t like coding for someone else. And so I suck at software engineering.

Now I wonder if it’s possible at all to decouple data science from software engineering. My instinct tells me that it should be possible. That I need not write production-level code in order to turn my data-based insights into commercially viable form. Unfortunately, in my search around the corporatosphere thus far, I haven’t been able to find something of the sort.

Which makes me wonder if I should create my own niche, rather than hoping for someone else to create it for me.