Taking sides on twitter

Garry Kasparov versus Nassim Nicholas Taleb
Joe Weisenthal versus Balaji Srinivasan

These are two twitter battles that have raged (ok the latter is muted in comparison) on my timeline during the last few days. I’ve been witness to these battles because I follow all of these worthies, who are each interesting for their own reason. But I don’t like these battles, and fights, and I find that apart from quickly scrolling through my timeline, there is no way for me to ignore these battles.

I find all four of these people independently interesting, and so don’t want to unfollow any of them just for the sake of avoiding being witness to these fights. But in due course of time, if any of them were to focus excessively on these fights (which is unlikely to happen) at the cost of other interesting tweets, I’m likely to unfollow.

These episodes, however, have given me an insight into why there is some sort of a political division in twitter following – that people who follow a set of argumentative people with one set of beliefs are unlikely to follow members from another set with the opposite kind of beliefs. This is because if you follow argumentative people from both sides, you end up getting caught in their argument which can contaminate your timeline.

You tolerate it for a while, but then over time you start losing patience. And you realise that the only way of avoiding following these arguments is by unfollowing, or even muting, people from one side of the argument. It is more likely that you unfollow the people whose beliefs agree with less. And you do this a sufficient number of times, and you’ll end up only following people whose beliefs you fully agree with.

And then they say social media is an echo chamber!

Anyway, the moral of the story for me is that I shouldn’t engage in protracted flamewars on twitter, for each time I do, I run the risk of losing followers who might also be following my counterparty in such flame wars.

The advantage of recurring payments

One of the best things about payments in the UK is the ubiquity of the direct debit system. From gym memberships to contact lenses to television licenses, all sorts of subscriptions are sold on a direct debit based model.

The mechanism is simple – the merchant, with the consent of the customer, sets up a direct debit system with the customer’s account such that a specified amount is debited periodically. This direct debit system can be cancelled at the customer’s discretion, resulting in automatic annulment of the subscription.

This is a great business model because it allows businesses to acquire customers for a repeated transaction, without the latter having to commit for too long a period.

The key feature of the direct debit system is the customer opt out. That the account will be continued by default means that it takes explicit action by the user to terminate the subscription, which helps the business acquire customers with the cost amortised over several time periods. The any time opt-out feature (which the user can do at her bank’s website or app, without consent of the merchant) means that the commitment at any time for the customer is for one period only, making the product an easier sell.

In the absence of the recurring payment based model, the business will either have to offer short term “subscriptions”, which implies a customer acquisition cost at each period, or long term contracts, which takes a higher upfront commitment from the customer making it a much harder sell.

In that sense, a recurring payment model offers a nice middle ground, resulting in value being unlocked for both the business and the customer, resulting in enhanced welfare all around.

In that sense, the lack of a recurring payments system is a key shortcoming of the payments scene in India. While it was possible to do this earlier, current rules by the Reserve Bank of India require authorisation by the customer (in the form of two factor authentication) for every transaction, making them opt-in rather than opt-out (the opt-out feature is key to amortise customer acquisition cost).

The updated version of the unified payments interface (UPI 2.0) was supposed to offer this recurring feature, but media reports say that the update is being rolled out without this feature. That is surely an opportunity missed for India’s businesses to grow.

Branding and positions of strength

I had an invitation to attend a data science networking event today. I had accepted the free pass for option value, but decided today to not exercise the option. Given I was not going to speak at the event, I realised that the value of the conversations at the event for me would be limited.

One of the internet gurus (it might be Naval Ravikant, but I’m unable to locate the source) has this principle that you shouldn’t go to networking events unless you’re speaking. Now, if everyone applied this principle events would look very different, with speakers speaking to one another (like in NED Talks!).

Thinking about it, though, I see clear value in this maxim. Basically when you go to a networking event and speak, you can network from a position of strength, especially after you’ve spoken. This is assuming you’ve done a good job of your speech, of course, but apart from elevating your status as a “speaker”, speaking at the event allows potential counterparties in conversations to have prior information about you before they talk to you.

So there is context in the conversation, and since you know they know something about you, you can speak from a position of strength, and hopefully make a greater impact.

It is not just about speaking and events. For a long time, a lot of my consulting business came from readers of this blog (yes, really!). This was because these people had been reading me, and knew me, and so when I spoke to them, there was already a “prior” on which I could base my sale. Of late, I’ve been putting out a lot of work-related content here and on LinkedIn, and that has sparked several conversations, which I have been able to navigate from a position of strength.

A possibly simpler word to describe this is “branding”. By speaking at an event or putting out content or indulging in other activities that let people know about you and what you do, you are building a brand. And then when the conversation happens, the brand you have thus built puts you in a position of strength which makes the sale far easier than if you didn’t have the brand.

You need to remember that position of strength as I’ve described here is not relative. It is not always necessary for the brand to elevate you to a level higher than the counterparty. All that is necessary is for it to put you at a high enough level that you don’t need to talk from a position of weakness. And if you think about it, cold calling and door to door sales is basically selling from a position of weakness – while it might have worked occasionally (which makes for fantastic stories), it is on the most part not successful.

And in some way, this concept of branding and positions of strength is well correlated to what I recently described as “the secret of my happiness“. By being really good at what you are good at, you are essentially putting yourself in a position of strength, so that people have no choice but to tolerate your inadequacies in other areas. Putting it another way, being really good at what you are good at is another exercise in brand building!

Brand building efforts can sometimes fail. There are times when I have given talks and got few questions – clearly indicating it was a wasted talk (either I didn’t talk well, or the audience didn’t get it). I have put out content that has just sank without a trace or any feedback. The important thing to know is that somewhere it all adds up – that these small efforts in branding can come together at some point in time, and make it work for you.


Attractive graphics without chart junk

A picture is worth a thousand words, but ten pictures are worth much less than ten thousand words

One of the most common problems with visualisation, especially in the media, is that of “chart junk”. Graphics designers working for newspapers and television channels like to decorate their graphs, to make it more visually appealing. And in most cases, this results in the information in the graphs getting obfuscated and harder to read.

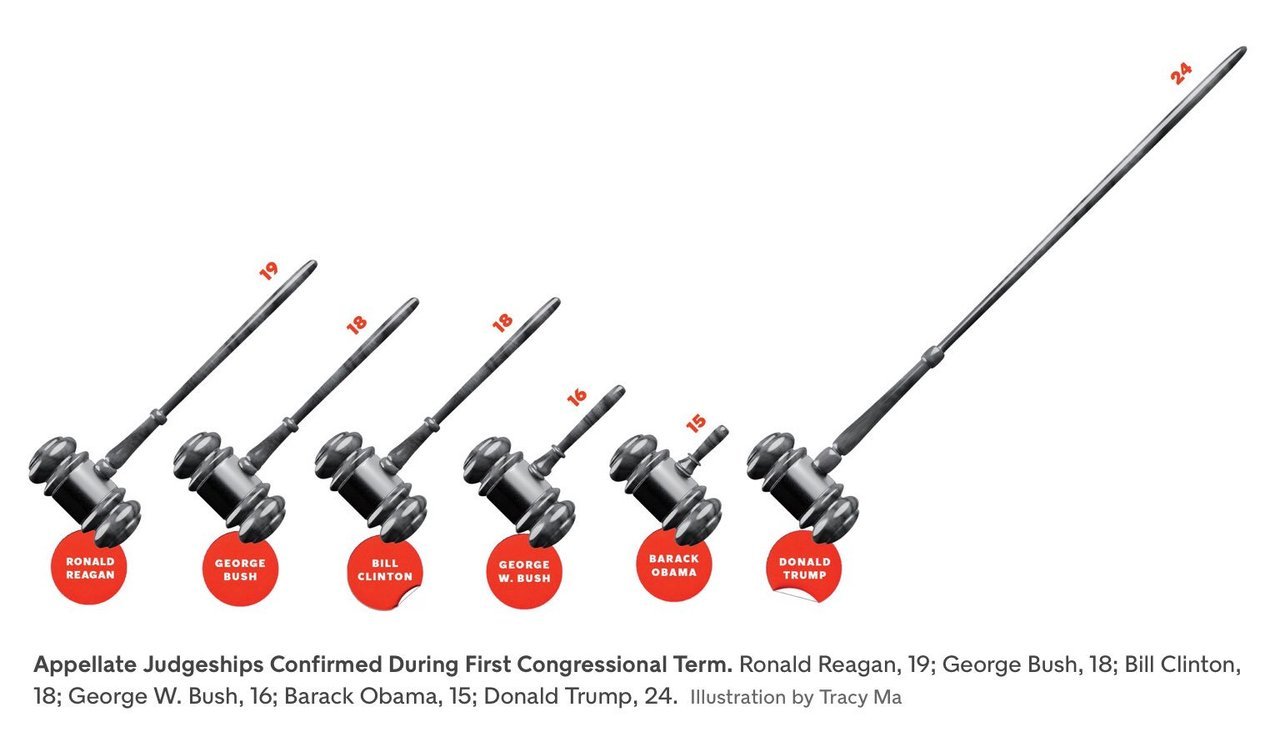
The commonest form this takes is in the replacement of bars in a simple bar graph with weird objects. When you want to show number of people in something, you show little people, sometimes half shaded out. Sometimes instead of having multiple people, the information is conveyed in the size of the people, or objects  (like below). 

Then, instead of using simple bar graphs, designers use more complicated structures such as 3-dimensional bar graphs, or cone graphs or doughnut charts (I’m sure I’ve abused some of them on my tumblr). All of them are visually appealing and can draw attention of readers or viewers. Most of them come at the cost of not really conveying the information!

I’ve spoken to a few professional graphic designers and asked them why they make poor visualisation choices even when the amount of information the graphics convey goes down. The most common answer is novelty – “a page full of bars can be boring for the reader”. So they try to spice it up by replacing bars with other items that “look different”.

Putting it another way, the challenge is two-fold – first you need to get your readers to look at your graph (here is where novelty helps). And once you’ve got them to look at it, you need to convey information to them. And the two objectives can sometimes collide, with the best looking graphs not being the ones that convey the best information. And this combination of looking good and being effective is possibly what turns visualisation into an art.

My way of dealing with this has been to play around with the non-essential bits of the visualisation. Using colours judiciously, for example. Using catchy headlines. Adding decorations outside of the graphs.

Another lesson I’ve learnt over time is to not have too many graphics in the same piece. Some of this has come due to pushback from my editors at Mint, who have frequently asked me to cut the number of graphs for space reasons. And some of this is something I’ve learnt as a reader.

The problem with visualisations is that while they can communicate a lot of information, they can break the flow in reading. So having too many visualisations in the piece means that you break the reader’s flow too many times, and maybe even risk your article looking academic. Cutting visualisations forces you to be concise in your use of pictures, and you leave in only the ones that are most important to your story.

There is one other upshot out of cutting the number of visualisations – when you have one bar graph and one line graph, you can leave them as they are and not morph or “decorate” them just for the heck of it!

PS: Even experienced visualisers are not immune to not having their graphics mangled by editors. Check out this tweet storm by Edward Tufte, the guru of visualisation.

Suckers still exist

Matt Levine’s latest newsletter describes a sucker of a trade:


  1. You give Citigroup Inc. $1,000, when Amazon.com’s stock is at $1,339.60.
  2. At the end of each quarter for the next three years, Citi looks at Amazon’s stock price. If it’s at or below $1,339.60, Citi sends you $25 and the trade continues. If it’s above $1,339.60, Citi sends you back your $1,000 and the trade is over.
  3. At the end of the three years, Citi looks at Amazon’s stock price. If it’s above $1,004.70 (75 percent of the initial stock price), then Citi sends you $1,025 and the trade is over. But if it’s below $1,004.70, you eat the full amount of the loss: For instance, if Amazon’s stock price is $803.80 (60 percent of the initial stock price), then you lose 40 percent of your money, and get back only $600. Citi keeps the rest. (You get to keep all the premiums, though.)

Anyone with half a brain should know that this is not a great trade.

For starters, it gives the client (usually a hedge fund or a pension fund or someone who represents rich guys) a small limited upside (of 10% per year for three years), while giving unlimited downside if Amazon lost over 25% in 3 years.

Then, the trade has a “knock out” (gets unwound with Citigroup paying back the client the principal) clause, with the strike price of the knockout being exactly the Amazon share price on the day the contract came into force. And given that Amazon has been on a strong bull run for a while now, it seems like a strange price at which to put a knock out clause. In other words, there is a high probability that the trade gets “knocked out” soon after it comes into existence, with the client having paid up all the transaction costs (3.5% of the principal in fees).

Despite this being such a shitty deal, Levine reports that Citigroup sold $16.3 million worth of these “notes”. While that is not a large amount, it is significant that nearly ten years after the financial crisis, there are still suckers out there, whom clever salespersons in investment banks can con into buying such shitty notes. It seems institutional memory is short (or these clients are located in states in the US where marijuana is legal).

I mean, who even buys structured notes nowadays?

PS: Speaking of suckers, I recently got to know of the existence of a school in Mumbai named “Our Lady of Perpetual Succour“. Splendid.

Taking your audience through your graphics

A few weeks back, I got involved in a Twitter flamewar with Shamika Ravi, a member of the Indian Prime Minister’s Economic Advisory Council. The object of the argument was a set of gifs she had released to show different aspects of the Indian economy. Admittedly I started the flamewar. Guilty as charged.

Thinking about it now, this wasn’t the first time I was complaining about her gifs – I began my now popular (at least on Twitter) Bad Visualisations tumblr with one of her gifs.

So why am I so opposed to animated charts like the one in the link above? It is because they demand too much of the consumer’s attention and it is hard to get information out of them. If there is something interesting you notice, by the time you have had time to digest the information the graphic has moved several frames forward.

Animated charts became a thing about a decade ago following the late Hans Rosling’s legendary TED Talk. In this lecture, Rosling used “motion charts” (a concept he possibly invented) – which was basically a set of bubbles moving around a chart, as he sought to explain how the condition of the world has improved significantly over the years.

It is a brilliant talk. It is a very interesting set of statistics simply presented, as Rosling takes the viewers through them. And the last phrase is the most important – these motion charts work for Rosling because he talks to the audience as the charts play out. He pauses when there is some explanation to be made or the charts are at a key moment. He explains some counterintuitive data points exhibited by the chart.

And this is precisely how animated visualisations need to be done, and where they work – as part of a live presentation where a speaker is talking along with the charts and using them as visual aids. Take Rosling (or any other skilled speaker) away from the motion charts, though, and you will see them fall flat – without knowing what the key moments in the chart are, and without the right kind of annotations, the readers are lost and don’t know what to look for.

There are a large number of aids to speaking that can occasionally double up as aids to writing. Graphics and charts are one example. Powerpoint (or Keynote or Slides) presentations are another. And the important thing with these visual aids is that the way they work as an aid is very different from the way they work standalone. And the makers need to appreciate the difference.

In business school, we were taught to follow the 5 by 5 formula (or some such thing) while making slides – that a slide should have no more than five bullet points, and each point should have no more than five words. This worked great in school as most presentations we made accompanied our talks.

Once I started working (for a management consultancy), though, I realised this didn’t work there because we used powerpoint presentations as standalone written communications. Consequently, the amount of information on each slide had to be much greater, else the reader would fail to get any information out of it.

Conversely, a powerpoint presentation meant as a standalone document would fail spectacularly when used to accompany a talk, for there would be too much information on each slide, and massive redundancy between what is on the slide and what the speaker is saying.

The same classification applies to graphics as well. Interactive and animated graphics do brilliantly as part of speeches, since the speaker can control what the audience is seeing and make sure the right message gets across. As part of “print” (graphics shared standalone, like on Twitter), though, these graphics fail as readers fail to get information out of them.

Similarly, a dense well-annotated graphic that might do well in print can fail when used as a visual aid, since there will be too much information and audience will not be able to focus on either the speaker or the graphic.

It is all about the context.

Analytics for general managers

While good managers have always been required to be analytical, the level of analytical ability being asked of managers has been going up over the years, with the increase in availability of data.

Now, this post is once again based on that one single and familiar data point – my wife. In fact, if you want me to include more data in my posts, you should talk to me more.

Leaving that aside, my wife works as a mid-level manager for an extremely large global firm. She was recruited straight out of business school for a “MBA track” program. And from our discussions about her work in the first few months, one thing she did lots of was writing SQL queries. And she still spends a lot of her time writing queries and building Excel models.

This isn’t something she was trained for, or was tested on while being recruited. She did her MBA in a famously diverse global business school, the diversity of its student bodies implying the level of maths and quantitative methods being kept rather low. She was recruited as a “general manager”. Yet, in a famously data-driven company, she spends a considerable amount of time on quantitative stuff.

It wasn’t always like this. While analytical ability has what (in my opinion) set apart graduates of elite MBA programs from those of middling MBA programs, the level of quantitative ability expected out of MBAs (apart from maybe those in finance) wasn’t too high. You were expected to know to use spreadsheets. You were expected to know some rudimentary statistics- means and standard deviations and some basic hypothesis testing, maybe. And you were expected to be able to make managerial decisions based on numbers. That’s about it.

Over the years, though, as the corpus of data within (and outside) organisations has grown, and making decisions based on data has become fashionable (a brilliant thing as far as I’m concerned), the requirement from managers has grown as well. Now they are expected to do more with data, and aren’t always trained for that.

Some organisations have responded to this problem by supplying “data analysts” who are attached to mid level managers, so that the latter can outsource the analytical work to the former and spend most of their time on “managerial” stuff. The problem with this is twofold – it is hard to guarantee a good career path to this data analyst (which makes recruitment hard), and this introduces “friction” – the manager needs to tell the analyst what precise data and analysis she needs, and iterating on this can lead to a lot of time lost.

Moreover, as the size of the data has grown, the complexity of the analysis that can be done and the insights that can be produced has become greater as well. And in that sense, managers who have been able to adapt to the volume and complexity of data have a significant competitive advantage over their peers who are less comfortable with data.

So what does all this mean for general managers and their education? First, I would expect the smarter managers to know that data analysis ability is a competitive advantage, and so invest time in building that skill. Second, I know of some business schools that are making their MBA programs less quantitative, as their student body becomes more diverse and the recruitment body becomes less diverse (banks are recruiting far less nowadays). This is a bad move. In fact, business schools need to realise that a quantitative MBA program is more of a competitive advantage nowadays, and tune their programs accordingly, while not compromising on the diversity of the student intake.

Then, there is a generation of managers that got along quite well without getting its hands dirty with data. These managers will now get challenged by younger managers who are more conversant with data. It will be interesting to see how organisations deal with this dynamic.

Finally, organisations need to invest in training programs, to make sure that their general managers are comfortable with data, and analysis, and making use of internal and external data science resources. Interestingly enough (I promise I hadn’t thought of this when I started writing this post), my company offers precisely one such workshop. Get in touch if you’re interested!

The secret of my happiness

Ok that’s an exaggerated title, but over the last few days I’ve figured how I like to “manage life” so as to increase my happiness – basically overdeliver on the things I like or am very good at, so that I can slack on other stuff.

In fact, this has been a formula I’ve followed through my life, and my periods of frustration have coincided with times when I haven’t been able to use this formula.

Let me take a few examples from recent life to illustrate how I’ve used this.

  1. Health: I like to eat lots of sweets and fatty foods (well, that’s a tautology – we’ve all evolved to like eating such foods), and in the past have been massively overweight and had issues with blood sugar and cholesterol. However I find diet control massively taxing mentally (though I did pull off 50 days of intermittent fasting earlier this year, though I think that contributed to a worsening of my ADHD).

    A few years back, however, I discovered weightlifting – more specifically, a combination of squats, bench press, shoulder press and deadlift. I only need to do this for about 45 minutes on 2 or 3 days a week, and I’ve found that it keeps me fit enough – irrespective of whatever junk I eat.

    So, having deadlifted 130 kg earlier this evening, I’ve felt “entitled” to eat whatever the hell I want, knowing it won’t harm me. And I will feel this way for another 2 days, when it is time to hit the gym again.

  2. Family responsibility: On weekday evenings, our parental responsibilities include preparing dinner, feeding the daughter, playing with her and putting her to sleep (I’m possibly oversimplifying). Of these activities, I’m not particularly fond of the second one, since it depends on a major factor outside of my control, which can tend to stress me. So I like to leave it to the wife to feed her.

    So on most days I grab the activities that I love doing – cooking and playing with the daughter (though maybe her mother’s games are more fun. I either play football or play songs on the keyboard for her to recognise). Doing these allows me to remain free of guilt when the wife undertakes the other responsibilities.

Going back several years, the secret of my happiness in school years was being insanely good at maths and science, which allowed me to slack off in the languages and social science. Being a topper also meant that I could talk my mind (including occasionally talking back to teachers), and people wouldn’t mind so much.

And then when I went to IIT, I was neither a topper nor was I good in a majority of the subjects, so these privileges were taken away and I was miserable. Towards the end, though, when I started preparing for CAT, which was something I was insanely good at, and that allowed me to make peace with not being particularly good with my academics at IIT. Later on, in my first job, things I’m good at such as lateral thinking or certain kinds of maths weren’t highly valued, and that didn’t allow me to slack on things I hated, and I quit in 3 months.

I don’t think this phenomenon is anything specific to me – I suspect that is how the human race operates (and hence we have lots of specialisation and trade). We maximise the benefits from stuff we’re good at, and hope that this allows to slack on other stuff. And in situations where we aren’t allowed to play to our strengths, we remain miserable.

Context sensitive and context free journalism

My wife thinks that most of my writing for Mint is incredibly boring, and of a significantly inferior quality to what I publish on this blog. Initially I thought it was because I was taking myself too seriously for Mint (a national newspaper and all that), but despite my attempts to “loosen up”, and write my Mint articles “in flow”, the criticism continues.

Now thinking about it, one reason why my writing for Mint might be boring is that in the beginning of each piece I try hard to provide context. I write without assuming that my readers know exactly what I’m writing about, and so I spend some time giving sufficient background so that my readers appreciate my articles (and most of my pieces appear with minimal edits).

This, I realise now, is not how Indian journalism usually works, for in a large majority of pieces it is assumed that the reader has context. Many a time I find myself reading a piece and not being able to make the head or tail of it, and then going back and trying to figure out the context. The point of several articles I’ve read has become clear only in retrospect, when I’ve found something else that this article was referencing (but didn’t link to).

On the other hand, a “newspaper” like The Economist mostly does context-free journalism. Every piece comes with sufficient background for the reader to know what is happening. There may not be links to find out more, but the limited context provided is enough to understand the point of the piece. Maybe that they are a weekly, and cover news from all over the world makes them want to provide context?

In any case, I find context-sensitive journalism (like what most daily newspapers practice) irritating. Or maybe it is that they haven’t really made the transition from print to digital? Print is a medium where the publisher controls what articles are seen together by a reader, and so one article can provide the required context to an adjacent article.

There is no such “togetherness” in digital. This strengthens my belief that journalism is still yet to “get” digital.

The market for gay relationships

The market for homosexual relationships is an interesting one from the analysis perspective. Like the market for heterosexual relationships, it is a matching market (we are in a relationship if and only if I like you AND you like me). Unlike heterosexual relationships, it is not a “bipartite” market, since both the nominal “buyer” and the “seller” in a transaction will come out (no pun intended) of the same pool (gay people of a particular sex).

The other factor that makes this market interesting (purely from an analysis perspective – it’s bad for the participants) is that there is disapproval at various levels for homosexual relationships. Until today, for example, it was downright criminal to indulge in gay sex in India. Even where it is legal, there is massive social and religious opposition to such relationships (think of the shootout at the gay bar in Florida, for example).

Social disapproval has meant that gays sometimes try to keep their sexuality under wraps. Historically, it has been a common practice for gays to enter into heterosexual marriages, and pursue relationships outside. In fact, there is nothing historical about this – read this excellent piece by Srinath Perur on gays in contemporary hinterland Karnataka, for whom Mohanaswamy, a collection of short stories with a gay protagonist, was a kind of life changer.

Organising a market for an item that is illegal, or otherwise frowned upon, is difficult, since people don’t want to be found participating in it. If I were a gay man looking for a partner, for example, I couldn’t go around openly looking for one if I didn’t want my family to know that I’m gay. So the first task would have been discovery – “safe spaces” where I would be happy to expose my sexuality, and where I could also meet potential partners.

When demand and supply exist, buyers and sellers will find a way to meet each other, though often at high cost. One such “way” for homosexual people has been the gay bar. Though not explicitly advertised, such bars act as focal points (I have a chapter on focal points in my book) for gay people.

They also act as an “anti focal point” (a topic I HAVEN’T covered in the book, for a change!) for heterosexual people who want to stay away because they don’t want to be hit on by gay people (thus reducing market congestion – another topic I cover in my book). Similarly other cultural activities have acted as focal points for gay people to get together and meet each other.

Like in heterosexual relationship markets (this is the link to a sample chapter from the book), the advent of dating apps has revolutionised gay dating, as apps such as Tinder and Grindr have provided safe spaces where gays can look for relationships “from the comfort of their homes”. There are studies that show that Grindr has changed the nature of relationships among gay men, and how these apps have “saved lives” in places such as India where homosexuality was criminal until today.

Today’s Indian Supreme Court ruling will have a massive positive impact on gay relationships in India. For starters, there are still millions of people in the closet – while apps such as Tinder and Grindr allowed more people to participate in these markets (since this could be done without really “coming out”), that gay sex was a criminal act would have led to some people to err on the side of caution (and deprive themselves of the chance of a relationship). Gay people who were worried about criminality, but not that much about social sanctions, will now be more willing to come out, leading to an increase in the market size.

Barring congestion (when “bad counterparties” prevent you from finding “good counterparties”),  the likelihood of finding a match in a market is generally proportional to the number of possible counterparties. Since gay relationship markets are not bipartite, we can say that the likelihood of finding a good match varies by the square of the number of market participants (and this brings in the Indian Prime Minister’s infamous 2ab term). In other words, it not only allows the people now coming into the market to find relationships, but it also allows existing players to find better relationships.

Then, there is the second order effect. Decriminalisation will mean that more people will come out of the closet, which will mean more people will find homosexuality to  be “normal” leading to better social mores (to take a personal example, I used to use the word “gay” as a pejorative (to mean “uncool”) until I encountered my first openly gay acquaintance – someone with whom I share on online mailing list). And as social attitudes towards homosexuality change, it will lead to more people coming out of the closet, setting off a virtuous cycle of acceptance of homosexuality.

In other words, today’s decision by the Indian Supreme Court is likely to set off a massive virtuous cycle in the liquidity of the market for homosexual relationships in India!

PS: It is a year since my first book was published, so we are running a promotional offer where you can buy the Kindle version for one dollar (or Rs. 70).