Built by Shanks

This morning, I found this tweet by John Burn-Murdoch, a statistician at the Financial Times, about a graphic he had made for a Simon Kuper (of Soccernomics fame) piece on Jose Mourinho.

Burn-Murdoch also helpfully shared the code he had written to produce this graphic, through which I discovered ClubElo, a website that produces chess-style Elo ratings for football clubs. They have a free and open API, through which Burn-Murdoch got the data for the above graphic, and which I used to download all-time Elo ratings for all clubs available (I can be greedy that way).

So the first order of business was to see how Liverpool’s rating has moved over time. The initial graph looked interesting, but not very interesting, so I decided to overlay it with periods of managerial regimes (the latter data I got through wikipedia). And this is what the all-time Elo rating of Liverpool looks like.

It is easy to see that the biggest improvement in the club’s performance came under the long reign of Bill Shankly (no surprises there), who took them from the Second Division to winning the old First Division. There was  brief dip when Shankly retired and his assistant Bob Paisley took over (might this be the time when Paisley got intimidated by Shankly’s frequent visits to the club, and then asked him not to come any more?), but Paisley consolidated on Shankly’s improvement to lead the club to its first three European Cups.

Around 2010, when the club was owned by Americans Tom Hicks and George Gillett and on a decline in terms of performance, this banner became popular at Anfield.
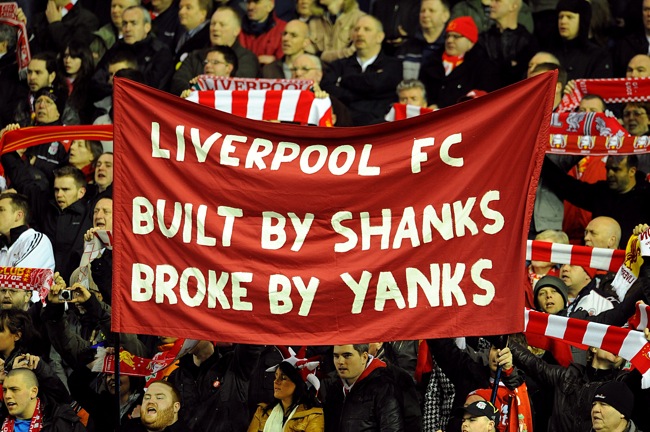
The Yanks were subsequently yanked following a protracted court battle, to be replaced by another Yank (John W Henry), under whose ownership the club has done much better. What is also interesting from the above graph is the managerial change decisions.

At the time, Kenny Dalglish’s sacking at the end of the 2011-12 season (which ended with Liverpool losing the FA Cup final to Chelsea) seemed unfair, but the Elo rating shows that the club’s rating had fallen below the level when Dalglish took over (initially as caretaker). Then there was a steep ascent under Brendan Rodgers (leading to second in 2013-14), when Suarez bit and got sold and the team went into deep decline.

Again, we can see that Rodgers got sacked when the team had reverted to the rating that he had started off with. That’s when Jurgen Klopp came in, and thankfully so far there has been a much longer period of ascendance (which will hopefully continue). It is interesting to see, though, that the club’s current rating is still nowhere near the peak reached under Rafa Benitez (in the 2008-9 title challenge).

Impressed by the story that Elo Ratings could tell, I got data on all Premier League managers, and decided to repeat the analysis for all clubs. Here is what the analysis for the so-called “top 6” clubs returns:

We see, for example, that Chelsea’s ascendancy started not with Mourinho’s first term as manager, but towards the end of Ranieri’s term – when Roman Abramovich had made his investment. We find that Jose Mourinho actually made up for the decline under David Moyes and Louis van Gaal, and then started losing it. In that sense, Manchester United have got their sacking timing right (though they were already in decline by the time they finished last season in second place).

Manchester City also seem to have done pretty well in terms of the timing of managerial changes. And Spurs’s belief in Mauricio Pochettino, who started off badly, seems to have paid off.

I wonder why Elo Ratings haven’t made more impact in sports other than chess!

AlphaZero Revisited

It’s been over a year since Google’s DeepMind first made its splash with the reinforcement-learning based chess playing engine AlphaZero. The first anniversary of the story of AlphaZero being released also coincided with the publication of the peer-reviewed paper.

To go with the peer-reviewed paper, DeepMind has released a further 200 games played between AlphaZero and the conventional chess engine StockFish, which is again heavily loaded in favour of wins for AlphaZero, but also contains 6 game where AlphaZero lost. I’ve been following these games on GM Daniel King’s excellent Powerplaychess channel, and want to revise my opinion on AlphaZero.

Back then, I had looked at AlphaZero’s play from my favourite studs and fighter framework, which in hindsight doesn’t do full justice to AlphaZero. From the games that I’ve seen from the set released this season, AlphaZero’s play hasn’t exactly been “stud”. It’s just that it’s much more “human”. And the reason why AlphaZero’s play possibly seems more human is because of the way it “learns”.

Conventional chess engines evaluate a position by considering all possible paths (ok not really, they use an intelligent method called Alpha-Beta Pruning to limit their search size), and then play the move that leads to the best position at the end of the search. These engines use “pre-learnt human concepts” such as point count for different pieces, which are used to evaluate positions. And this leads to a certain kind of play.

AlphaZero’s learning, process, however, involves playing zillions of games against itself (since I wrote that previous post, I’ve come back up to speed with reinforcement learning). And then based on the results of these games, it evaluates positions it reached in the course of play (in hindsight). On top of this, it builds a deep learning model to identify the goodness of positions.

Given my limited knowledge of how deep learning works, this process involves AlphaZero learning about “features” of games that have more often than not enabled it to win. So somewhere in the network there will be a node that represents “control of centre”. Another node deep in the network might represent “safety of king”. Yet another might perhaps involve “open A file”.

Of course, none of these features have been pre-specified to AlphaZero. It has simply learnt it by training its neural network on zillions of games it has played against itself. And while deep learning is hard to “explain”, it is likely to have so happened that the features of the game that AlphaZero has learnt are remarkably similar to the “features” of the game that human players have learnt over the centuries. And it is because of the commonality in these features that we find AlphaZero’s play so “human”.

Another way to look at is from the concept of “10000 hours” that Malcolm Gladwell spoke about in his book Outliers. As I had written in my review of the book, the concept of 10000 hours can be thought of as “putting fight until you get enough intuition to become stud”. AlphaZero, thanks to its large number of processors, has effectively spent much more than “10000 hours” playing against itself, with its neural network constantly “learning” from the positions faced and the outcomes of the game reached. And this way, it has “gained intuition” over features of the game that lead to wins, giving it an air of “studness”.

The interesting thing to me about AlphaZero’s play is that thanks to its “independent development” (in a way like the Finches of Galapagos), it has not been burdened by human intuition on what is good or bad, and learnt its own heuristics. And along the way, it has come up with a bunch of heuristics that have not commonly be used by human players.

Keeping bishops on the back rank (once the rooks have been connected), for example. A stronger preference for bishops to knights than humans. Suddenly simplifying from a terrifying-looking attack into a winning endgame (machines are generally good at endgames, so this is not that surprising). Temporary pawn and piece sacrifices. And all that.

Thanks to engines such as LeelaZero, we can soon see the results of these learnings being applied to human chess as well. And human chess can only become better!

Bayesian Reasoning and Indian Philosophy

I’m currently reading a book called How the World Thinks: A global history of philosophy by Julian Baggini. I must admit I bought this by mistake – I was at a bookshop where I saw this book and went to the Amazon website to check reviews. And by mistake I ended up hitting buy. And before I got around to returning it, I started reading and liking it, so I decided to keep it.

In any case, this book is a nice comparative history of world philosophies, with considerable focus on Indian, Chinese, Japanese and Islamic philosophies. The author himself is trained in European/Western philosophy, but he keeps an open mind and so far it’s been an engaging read.

Rather than approaching the topic in chronological order, like some historians might have been tempted to do, this book approaches it by concept, comparing how different philosophies treat the same concept. And the description of Indian philosophy in the “Logic” chapter caught my eye, in the sense that it reminded me of Bayesian logic, and a piece I’d written a few years back.

Talking about Hindu philosophy and logic, Baggins writes:

For instance, the Veda affirms that when the appropriate sacrifice for the sake of a son is performed, a son will be produced. But it is often observed that a son is not produced, even though the sacrifice has been performed. This would seem to be pretty conclusive proof that the sacrifices don’t work and so the Veda is flawed. Not, however, if you start from the assumption that the Veda cannot be flawed.

In other words, Hindu Philosophy starts with the Bayesian prior that the Veda cannot be flawed. Consequently, irrespective of how strong the empirical evidence that the Vedas are flawed, the belief in the Vedas can never change! On the other hand, if the prior probability that the Vedas were flawed were positive but even infinitesimal, then the amount of evidences such as the above (where sacrifices that are supposed to have produced sons but fail to do so) would over time result in the probability of the Vedas being flawed increasing, and soon tending to 1.

In 2015, I had written in Mint about how Bayesian logic can be used to explain online flame wars. There again, I had written about how when people start with extreme opinions (probabilities equal to 0 or 1), even the strongest contrary evidence is futile to get them to change their opinions. And hence in online flame wars you have people simply talking past each other because neither is willing to update their opinions in the face of evidence.

Coming back to Hindu philosophy, this prior belief that the Vedas cannot be flawed reminds me of the numerous futile arguments with some of my relatives who are of a rather religious persuasion. In each case I presented to them what seemed like strong proof that some of their assumptions of religion are flawed. In each case, irrespective of the strength of my evidence, they refused to heed my argument. Now, looking at the prior of a religious Hindu – that the likelihood of the Vedas being flawed is 0 (not infinitesimal, but 0), it is clear why my arguments fell on deaf ears.

In any case, Baggini goes on to say:

By this logic, if ‘a son is sure to be produced as a result of performing the sacrifice’ but a son is not produced, it can only follow that the sacrifice was not performed correctly, however much it seems that it was performed properly. By such argument, the Ny?ya S?tra can safely conclude, ‘Therefore there is no untruth in the Veda.’

Just Plot It

One of my favourite work stories is from this job I did a long time ago. The task given to me was demand forecasting, and the variable I needed to forecast was so “micro” (this intersection that intersection the other) that forecasting was an absolute nightmare.

A side effect of this has been that I find it impossible to believe that it’s possible to forecast anything at all. Several (reasonably successful) forecasting assignments later, I still dread it when the client tells me that the project in question involves forecasting.

Another side effect is that the utter failure of standard textbook methods in that monster forecasting exercise all those years ago means that I find it impossible to believe that textbook methods work with “real life data”. Textbooks and college assignments are filled with problems that when “twisted” in a particular way easily unravel, like a well-tied tie knot. Industry data and problems are never as clean, and elegance doesn’t always work.

Anyway, coming back to the problem at hand, I had struggled for several months with this monster forecasting problem. Most of this time, I had been using one programming language that everyone else in the company used. The code was simultaneously being applied to lots of different sub-problems, so through the months of struggle I had never bothered to really “look at” the data.

I must have told this story before, when I spoke about why “data scientists” should learn MS Excel. For what I did next was to load the data onto a spreadsheet and start looking at it. And “looking at it” involved graphing it. And the solution, or the lack of it, lay right before my eyes. The data was so damn random that it was a wonder that anything had been forecast at all.

It was also a wonder that the people who had built the larger model (into which my forecasting piece was to plug in) had assumed that this data would be forecast-able at all (I mentioned this to the people who had built the model, and we’ll leave that story for another occasion).

In any case, looking at the data, by putting it in a visualisation, completely changed my perspective on how the problem needed to be tackled. And this has been a learning I haven’t let go of since – the first thing I do when presented with data is to graph it out, and visually inspect it. Any statistics (and any forecasting for sure) comes after that.

Yet, I find that a lot of people simply fail to appreciate the benefits of graphing. That it is not intuitive to do with most programming languages doesn’t help. Incredibly, even Python, a favoured tool of a lot of “data scientists”, doesn’t make graphing easy. Last year when I was forced to use it, I found that it was virtually impossible to create a PDF with lots of graphs – something that I do as a matter of routine when working on R (I subsequently figured out a (rather inelegant) hack the next time I was forced to use Python).

Maybe when you work on data that doesn’t have meaningful variables – such as images, for example – graphing doesn’t help (since a variable on its own has little information). But when the data remotely has some meaning – sales or production or clicks or words, graphing can be of immense help, and can give you massive insight on how to develop your model!

So go ahead, and plot it. And I won’t mind if you fail to thank me later!

Ticking all the boxes

Last month my Kindle gave up. It refused to take charge, only heating up the  charging cable (and possibly destroying an Android charger) in the process. This wasn’t the first time this was happening.

In 2012, my first Kindle had given up a few months after I started using it, with its home button refusing to work. Amazon had sent me a new one then (I’d been amazed at the no-questions-asked customer-centric replacement process). My second Kindle (the replacement) developed problems in 2016, which I made worse by trying to pry it open with a knife. After I had sufficiently damaged it, there was no way I could ask Amazon to do anything about it.

Over the last year, I’ve discovered that I read much faster on my Kindle than in print – possibly because it allows me to read in the dark, it’s easy to hold, I can read without distractions (unlike phone/iPad) and it’s easy on the eye. I possibly take half the time to read on a Kindle what I take to read in print. Moreover, I find the note-taking and highlighting feature invaluable (I never made a habit of taking notes on physical books).

So when the kindle stopped working I started wondering if I might have to go back to print books (there was no way I would invest in a new Kindle). Customer care confirmed that my Kindle was out of warranty, and after putting me on hold for a long time, gave me two options. I could either take a voucher that would give me 15% off on a new Kindle, or the customer care executive could “talk to the software engineers” to see if they could send me a replacement (but there was no guarantee).

Since I had no plans of buying a new Kindle, I decided to take a chance. The customer care executive told me he would get back to me “within 24 hours”. It took barely an hour for him to call me back, and a replacement was in my hands in 2 days.

It got me wondering what “software engineers” had to do with the decision to give me a replacement (refurbished) Kindle. Shortly I realised that Amazon possibly has an algorithm to determine whether to give a replacement Kindle for those that have gone kaput out of warranty. I started  trying to guess what such an algorithm might look like.

The interesting thing is that among all the factors that I could list out based on which Amazon might make a decision to send me a new Kindle, there was not one that would suggest that I shouldn’t be given a replacement. In no particular order:

  • I have been an Amazon Prime customer for three years now
  • I buy a lot of books on the Kindle store. I suspect I’ve purchased books worth more than the cost of the Kindle in the last year.
  • I read heavily on the Kindle
  • I don’t read Kindle books on other apps (phone / iPad / computer)
  • I haven’t bought too many print books from Amazon. Most of the print books I’ve bought have been gifts (I’ve got them wrapped)
  • My Goodreads activity suggests that I don’t read much outside of what I’ve bought from the Kindle store

In hindsight, I guess I made the correct decision of letting the “software engineers” determine whether I qualify for a new Kindle. I guess Amazon figured that had they not sent me a new Kindle, there was a significant amount of low-marginal-cost sales that they were going to lose!

I duly rewarded them with two book purchases on the Kindle store in the course of the following week!

The Cow-Postman Paradigm

I thought I had written about this already sometime ago, but I can’t seem to find it. Anyways.

When we were in class 6, we were taught to write essays in Hindi. “Taught to write” is a loose phrase there, for we were just given two essays and asked to mug them up. One was on “gaay” (cow) and the other was on “daakiya” (postman). The teacher had reliably informed us that while the exam would have a question requiring us to write an essay, the topic would be either “gaay” or “daakiya”. And it was a given that mugging up the given essay and spitting it out would get full credit.

To my credit (I used to be topper types, you remember?), I mugged up both. This girl who was at my van stop didn’t. She only mugged up “gaay” since that seemed to be the more likely to appear in the exam. Another girl, two years our senior, who had been through this routine, consoled her saying that if the question is for “daakiya”, she can still write about “gaay”, and she would get at least 2 out of 5 marks.

As it happened, the exam required us to write a question on daakiya. The girl in my van stop wrote an essay on gaay. And got 0 for it.

This brings me to a fairly common practice, at least in India, of coming up with a set of answers and spouting them out irrespective of what the question is. And I call this the “cow-postman paradigm” based on the above anecdote.

A popular example of the cow-postman paradigm can be seen at beauty contests, where the beauty queens spout inanities in order to show off their “nobility” and show themselves as being “worthy ambassadors” of the Miss Whatever project. The most famous example of this probably is Priyanka Chopra, who answered “Mother Teresa” when asked who is the “living woman she most admires” (Mother Teresa had died two years before Priyanka Chopra became Miss World).

Politicians and PR agents are also masters of the Cow-Postman paradigm. Irrespective of what interviewers ask, they simply spout their prepared lines  in the hope that it will sometimes answer the question. In case the interviewer decides to be snarky, this can be made fun of. In most cases, the “leaders” get away with it.

It is possibly these instances of “getting away with it” (or even “benefitting from it”) that results in propagating the Cow-Postman paradigm. Maybe it is a worthy effort of journalists, possibly at listicle-based publications, to make note of and make a list of such famous cow-postman instances. That’s the only way we can cure it!


When Jayalalithaa Ruined My Birthday

As the Babri Masjid was being brought down, I celebrated.

I had come up with this line a few years ago, and said that whenever I write my autobiography, I’m going to begin it this way. And while I’m not as certain nowadays that I’ll write an autobiography, in case I write one I’ll still use this line to open it.

This line could also be used in a logic class, the kind of lectures I delivered fairly frequently between 2012 and 2016, illustrating logical fallacies. For this one might induce the correlation-is-causation fallacy in your head, and you might think that if I celebrated while the Babri Masjid was being brought down, I must be a Muslim-hating bigot. So here is what will be the second line in my autobiography, whenever I write it:

It was my tenth birthday, and there was a party at home.

There is something special about your birthday falling on Sundays. The first time that happened, in 1987, was also the first time that my parents organised a birthday party for me. I’m too young to know how many people came, but there were a lot of people filling our house that evening. We had professional catering and I got so many gifts that I got to using some of them (such as Enid Blyton story books) several years later.

Maybe I read some of the books around the time my birthday fell on a Sunday once again, which happened in 1992. That also happened to be the next time I had a party at home, and this one was different, with less than ten guests, with all of them being my classmates in school.

My mother had done the cooking that day. We played cricket and hide-and-seek, and some other party games (which I don’t remember now). And then later that evening, news on television told us that the Babri Masjid had been brought down that day and riots had started.


The only thing that registered in my head then was that there would be no school the next day, and I didn’t know when I would distribute the chocolates I had bought for the customary school distribution.

The long term impact, though, was that my birthday got inextricably linked to the Babri Masjid demolition.

So over the years, when people have searched for an anchor to remember my birthday, they’ve inevitably used news of the anniversary of the Babri Masjid demolition. This morning, for example, I got a message that said “Happy birthday. Babri Masjid article came up somewhere 🙂 “. Another friend messaged me to remind me of what I’ve written to being this post.

A couple of years back, a friend messaged me later in December apologising for missing my birthday, adding that he had missed it because there wasn’t much news about the Babri Masjid anniversary. This must have been in 2016, which was among my worst birthdays because beyond close family, hardly anyone wished me that day.

And I blame former Tamil Nadu chief minister Jayalalithaa for that, for after a rather prolonged illness, she had passed away the previous night. And that meant that the news waves in India on the 6th of December 2016 were filled with news of Jayalalithaa’s demise, with any Babri Masjid anniversary stuff being pushed to the backburner.

The situation got rectified last year with it being the 25th anniversary of the Babri Masjid demolition, so the number of people who wished me went back to “normal levels”. And perhaps with elections being round the corner again, and without an important death to distract the news, I’m guessing that Babri Masjid has made enough news today for enough people to remember my birthday!

I must also take this opportunity to thank certain entities who unfailingly wish me on every birthday.

Oh, and I discovered this morning that today is 6/12/18. And my wife helpfully added that I turned 36 today.

Now I feel really old!

What Ails Liverpool

So Liverpool FC has had a mixed season so far. They’re second in the Premier League with 36 points from 14 games (only points dropped being draws against ManCity, Chelsea and Arsenal), but are on the verge of going out of the Champions League, having lost all three away games.

Yesterday’s win over Everton was damn lucky, down to a 96th minute freak goal scored by Divock Origi (I’d forgotten he’s still at the club). Last weekend’s 3-0 against Watford wasn’t as comfortable as the scoreline suggested, the scoreline having been opened only midway through the second half. The 2-0 against Fulham before that was similarly a close-fought game.

Of concern to most Liverpool fans has been the form of the starting front three – Mo Salah, Roberto Firmino and Sadio Mane. The trio has missed a host of chances this season, and the team has looked incredibly ineffective in the away losses in the Champions League (the only shot on target in the 2-1 loss against PSG being the penalty that was scored by Milner).

There are positives, of course. The defence has been tightened considerably compared to last season. Liverpool aren’t leaking goals the way they did last season. There have been quite a few clean sheets so far this season. So far there has been no repeat of last season’s situation where they went 4-1 up against ManCity, only to quickly let in two goals and then set up a tense finish.

So my theory is this – each of the front three of Liverpool has an incredibly low strike rate. I don’t know if the xG stat captures this, but the number of chances required by each of Mane, Salah and Firmino before they can convert is rather low. If the average striker converts one in two chances, all of these guys convert one in four (these numbers are pulled out of thin air. I haven’t looked at the statistics).

And even during the “glory days” of last season when Liverpool was scoring like crazy, this low strike rate remained. Instead, what helped then was a massive increase in the number of chances created. The one game I watched live (against Spurs at Wembley), what struck me was the number of chances Salah kept missing. But as the chances kept getting created, he ultimately scored one (Liverpool lost 4-1).

What I suspect is that as Klopp decided to tighten things up at the back this season, the number of chances being created has dropped. And with the low strike rate of each of the front three, this lower number of chances translates into much lower number of goals being scored. If we want last season’s scoring rate, we might also have to accept last season’s concession rate (though this season’s goalie is much much better).

There ain’t no such thing as a free lunch.

Showing off

So like good Indian parents we’ve started showing off the daughter in front of guests. And today she showed us that she’s equal to the task.

A couple of weeks back, after seeing the photo of a physicist friend’s son with the book Quantum Physics for babies, I decided to get a copy. Like with all new things the daughter gets, she “read” the book dutifully for the rest of the day it arrived. She learnt to recognised the balls in the book, but wasn’t patient enough for me to teach her about atoms.

The next day the book got put away into her shelf, never to appear again, until today that is. Some friends were visiting and we were all having lunch. As I was feeding the daughter she suddenly decided to run off towards her bookshelf, and with great difficulty pulled out a book – this one. As you might expect, our guests were mighty impressed.

Then they started looking at her bookshelf and were surprised to find a “children’s illustrated atlas” there. We told them that the daughter can identify countries as well. Soon enough, she had pulled out the atlas from the shelf (she calls it the “Australia book”) and started pointing out continents an d countries in that.

To me the high point was the fact that she was looking at the maps upside down (or northside-down – the book was on the table facing the guests), and still identified all the countries and continents she knows correctly. And once again, I must point out that she hadn’t seen the atlas for at least two or three weeks now.

Promise is showing, but we need to be careful and make sure we don’t turn her into a performing monkey.

PS: Those of you who follow me on Instagram can look at this video of Berry identifying countries.

PS2: Berry can identify continents on a world map, but got damn disoriented the other day when I was showing her a map that didn’t contain Antarctica.

Magnus Carlsen’s Endowment

Game 12 of the ongoing Chess World Championship match between Magnus Carlsen and Fabiano Caruana ended in an unexpected draw after only 31 moves, when Carlsen, in a clearly better position and clearly ahead on time, made an unexpected draw offer.

The match will now go into a series of tie-breaks, played with ever-shortening time controls, as the world looks for a winner. Given the players’ historical record, Carlsen is the favourite for the rapid playoffs. And he knows it, since starting in game 11, he seemed to play towards taking it into the playoffs.

Yesterday’s Game 12 was a strange one. It started off with a sharp Sicilian Pelikan like games 8 and 10, and then between moves 15 and 20, players repeated the position twice. Now, the rules of chess state that if the same position appears three times on the board, the game is declared a draw. And there was this move where Caruana had the chance to repeat a position for the third time, thus drawing the game.

He spent nearly half an hour on the move, and at the end of it, he decided to deviate. In other words, no quick draw. My suspicion is that this unnerved Carlsen, who decided to then take a draw at the earliest available opportunity available to him (the rules of the match state that a draw cannot be agreed before move 30. Carlsen made his offer on move 31).

In behavioural economics, Endowment Effect refers to the bias where you place a higher value on something you own than on something you don’t own. This has several implications, all of which can lead to potentially irrational behaviour. The best example is “throwing good money after bad” – if you have made an investment that has lost money, rather than cutting your losses, you double down on the investment in the hope that you’ll recoup your losses.

Another implication is that even when it is rational to sell something you own, you hold on because of the irrationally high value you place on it. The endowment effect also has an impact in pricing and negotiations – you don’t mind that “convenience charge” that the travel aggregator adds on just before you enter your credit card details, for you have already mentally “bought” the ticket, and this convenience charge is only a minor inconvenience. Once you are convinced that you need to do a business deal, you don’t mind if the price moves away from you in small marginal steps – once you’ve made the decision that you have to do the deal, these moves away are only minor, and well within the higher value you’ve placed on the deal.

So where does this fit in to Carlsen’s draw offer yesterday? It was clear from the outset that Carlsen was playing for a draw. When the position was repeated twice, it raised Carlsen’s hope that the game would be a draw, and he assumed that he was getting the draw he wanted. When Caruana refused to repeat position, and did so after a really long think, Carlsen suddenly realised that he wasn’t getting the draw he thought he was getting.

It was as if the draw was Carlsen’s and it had now been taken away from him, so now he needed to somehow get it. Carlsen played well after that, and Caruana played badly, and the engines clearly showed that Carlsen had an advantage when the game crossed move 30.

However, having “accepted” a draw earlier in the game (by repeating moves twice), Carlsen wanted to lock in the draw, rather than play on in an inferior mental state and risk a loss (which would also result in the loss of the Championship). And hence, despite the significantly superior position, he made the draw offer, which Caruana was only happy to accept (given his worse situation).