How “non-vegetarian” is India?

Last week, after Master Chef India announced that the next season is going to be all-vegetarian, there was considerable outrage on social media. Most of the outrage contended that this was a result of the Hindu right dominating the narrative, and quoted studies that said that over 80% of India eats meat. It didn’t help that sponsors of Masterchef this season are Amul (the milk cooperative) and the Adani group, which is known to be close to the Prime Minister.

In this context, this chart from the Washington Post is quite instructive. The chart indicates the per capita per year consumption of various meats across different countries. It takes a lot of effort to find India in this chart, since it is almost non-existent. This chart shows how little meat per capita is actually consumed in India.

source: http://www.washingtonpost.com/blogs/wonkblog/wp/2014/07/14/the-coming-global-domination-of-chicken/

While it might be true that 80% of India’s population is not averse to eating meat, the actual fact on the ground is that very little meat is actually consumed. Which makes is okay to term India as a largely vegetarian country.

Whether that should necessitate a vegetarian-only cookery show on TV, though, is another matter and one that this blog has no opinion on.

From STD Booths to Information Kiosks

An IT Action plan submitted to the first NDA government in 1998 had envisaged a plan to “turn STD/ISD booths to information kiosks”. Considering that this was at a time when most of India did not have even a basic dial-up connection to the internet, it can be thought to be pretty far-sighted.

The PIB notification says:

Internet access nodes to be opened by DoT and authorised ISPs in all district headquarters by January 26, 2000, and, until then, Internet access from the nearest node on local call rates; upgradation of STD/ISD booths into full-service ‘information kiosks’ offering e-mail, voice mail and Internet; and permission for the Railways, Defence, State Electricity Boards, National Power Grid Corporation as well as organisations like ONGC, GAIL and SAIL to use their fibre optic backbone to provide service to the public by interfacing with existing or new public networks.

In a speech in 2004, towards the end of his full term, then Prime Minister Atal Behari Vajpayee had mentioned the same idea. Speaking at the inauguration of the TIDEL Park in Chennai, he had said:

There is an urgent need to generate useful educational, commercial, and other types of content on the Internet in Indian languages. As an example, I would like to see information kiosks to become as common across the country as STD booths, where ordinary people can access e-mail in Indian languages and also receive useful information about programmes, schemes, and facilities made available by the Government, banks, and other institutions.

In 1998, after the panel had submitted its report, Vajpayee had set up a high-level ministerial committee to look into the recommendations and come up with an implementation plan. I’m not sure much came of it.

Speaking of STD booths and information kiosks, though, it is very interesting to see what New York is doing with its telephone booths. The Washington Post reports:

The city announced Monday that it had selected a consortium of advertising, technology and telecom companies to deploy throughout the city thousands of modern-day pay phones that will offer 24-hour, free gigabit WiFi connections, free calls to anywhere in the U.S., touch-screen displays with direct access to city services, maps and directions for tourists, and charging stations (for the cellphones you’d rather use). The devices will also be capable of connecting people straight to emergency responders, and broadcasting alerts from the city during emergencies like Hurricane Sandy.

This is very impressive. Rather than doing away with PCOs like they’ve done in the Netherlands, this seems like an extremely interesting way to make use of them. I hope we can implement some of these in India, too. Considering that it was under a BJP government that the STD Booth to Information Kiosk idea first came up, I hope that the current government takes steps to implement it.

A/B testing with large samples

Out on Numbers Rule Your World, Kaiser Fung has a nice analysis on Andrew Gelman’s analysis of the Facebook controversy (where Facebook apparently “played with people’s emotions” by manipulating their news feeds. The money quote from Fung’s piece is here:

Sadly, this type of thing happens in A/B testing a lot. On a website, it seems as if there is an inexhaustible supply of experimental units. If the test has not “reached” significance, most analysts just keep it running. This is silly in many ways but the key issue is that if you need that many samples to reach significance, it is guaranteed that the measured effect size is tiny, which also means that the business impact is tiny.

This refers to a common fallacy that I’ve often referred to on this blog, and in my writing elsewhere. Essentially, when you have really large sample sizes, even small changes in measured values can be statistically significant. The fact that they are statistically significant, however, does not mean that they have a business impact – sometimes the effect is so small that the only significance it has is statistical!

So before you blindly make business decisions based on statistical significance, you need to take into account whether the measured difference is actually significant enough to have an impact on your business! It may not strictly be “noise” – for the statistical significance test has shown that it’s not “noise”, but it is essentially an effect that, for all business purposes, can be ignored.

PS: Fung and Gelman are among my two favourite bloggers when it comes to statistics and quant. A lot of what I’ve learnt on this subject is down to these two gentlemen. If you’re interested in statistics and quant and visualisation I recommend you to subscribe to both of Fung’s feeds and to Gelman’s feed.

Currency confusion

Arvind Panagariya has an excellent piece in the Business Standard on how “tax terrorism” has created a poor investment atmosphere, and if not reversed quickly, might be the undoing of the “Make In India” campaign. While the piece itself is brilliant, my problem with it is that it mixes currencies and numbering systems without providing “translations”. Sample these two extracts:

In 2013, Nokia decided to exit mobile and smartphone manufacturing and sold its worldwide operations to Microsoft. Around the same time, the income tax department retrospectively assessed a sum of Rs 15,258 crore in tax liability against Nokia, India and placed a lien on its Chennai operations.

and

But in our zeal to immediately generate a large volume of revenues, we have compromised that prospect. Ironically, in doing so, we may not have added much to our revenue kitty either. Already, the tax authorities have lost a $3 billion tax claim against Shell in the Bombay High Court.

Now, $3 billion is approximately equal to Rs 18,000 Crores, which makes the size of Shell’s tax dispute to be of the same order of magnitude as Nokia’s. However, being presented in different currencies (the Nokia number is mentioned up to five significant digits, for no good reason), it makes it hard for the reader to compare the two numbers and appreciate their similarity!

Unrelated to this piece but another similar problem in reporting in Indian newspapers is the confusion of Indian and Western systems of representing large numbers. Some numbers are represented in lakhs and crores, and others in millions and billions, and while the two might be in the same “units”, it is still an effort on behalf of the reader to appreciate.

It would be a great idea for newspapers to put down as part of their editorial policies a note on expressing all numbers in a given piece in the same units and numbering systems (providing translations where said units or systems are not “native” to the data being presented). This will go a long way in helping readers appreciate the numbers.

Tailpiece: I read the first part of this piece assuming that it had been written by Arvind Subramanian (Chief Economic Adviser to MoF) and was quite surprised at the candour expressed by a member of the government. Evidently, I’m not the only person to have got confused between these two Arvinds.

What is the feminine of Amit?

“Amit” is a word that is commonly used, often pejoratively, to refer to men from the North of India. The reason for the usage of “Amit” in this context is that while it is an extremely common name for men from North India, it is not as common in other parts of India, and thus it characterises men from North India.

A question that has been floating around in social media circles for a long time in this connection is what the feminine form of “Amit” is. If Amit characterises the median North Indian male, what name characterises the median North Indian female? Popular candidates for this are Neha, Isha and Pooja. Pooja suffers from the fact that is is also a fairly common name in other parts of India. Isha, while it might be strongly North Indian, is too obscure. And for some reason, people are loathe to accept Neha as the feminine Amit. So how do we resolve this?

I, being a stud, am a big follower of the Hanuman principle. If you have to solve a problem, and it takes no more effort to solve a generic problem, then solve the generic problem and apply it to this problem as a special instance rather than spending time to solve each instance. Hence, we will rephrase this problem as “What first name uniquely identifies a particular ethnicity?”. I, being a quant, am going to use the quantitative hammer to hammer down this nail. So we can rephrase as “how can we quantitatively characterise ethnicities by first names?”

The first thing to notice is that we need a frame of reference. Amit is a good name to characterise a North Indian man among the universe of Indian men. However, if we define the universe differently, as “Asian” for example, or “men living in Delhi”, Amit may not be as characteristic at all. Hence, any formula that we develop needs to take into account the frame of reference.

Secondly, what makes a name ethnically characteristic? I argue that there are two factors, and these two will be used in deriving the final formula. Firstly, the name should be common among the particular ethnicity – for example, Murugaselvan is extremely characteristic of Tamil men, but its occurrence is so low that using Murugaselvan as the median Tamil man among all Indian men is futile. Secondly, the name should be distinctive for that particular community. For example, a possible competitor to Amit is Rahul, a name that is possibly as common among North Indians as Amit is (I haven’t seen the statistics). The problem with Rahul, however, is that it is a fairly common name in South India also! So it does a bad job in terms of discrimination. So basically what we are looking for is a name that is both popular in the ethnicity we want to characterise, and also characteristic to that particular ethnicity in comparison to the universe.

These two requirements lead to the following rather simple formula (I’m not claiming that this is the best formula – if there is a way to objectively evaluate such formulas, that is – but it is sufficiently good and simple to understand and evaluate). Let our universe by U and the community we are trying to characterise by C. C’ is {U – C} (I’m assuming all of you know set theoretic notation). The first name N that characterises the community C is the one that maximises P(N|C) – P(N|C’). That’s it. Simple.

To explain in English, for each first name, we calculate the incidence of that particular name in the community C. That is, for example, what proportion of North Indian girls are named Neha, Pooja, Isha, Nidhi, etc. Next, we calculate the incidence of the name in the “complement of C”, that is how likely is it that someone in the rest of the “universe” we have defined has the same name. In our above example, we calculate what proportion of Indian but NOT North Indian girls (taking Indian women as the universe) are named Neha, Pooja, Isha, Nidhi, etc. Then, for each name, we subtract the latter quantity from the former quantity and then select the name for which this difference is maximum! Rather simple, I would think!

Now, we need data. Unfortunately I can’t seem to find any publicly available data sets that contain long lists of names along with markers of ethnicity (address or city or state or language preference or some such). If you can help me with some data sets, we can actually run the above formula for different ethnicities and characterise them. It is going to be a fun exercise, I promise! So pour in the data. And I request you to share publicly available data and not proprietary data.

And then we can for once and for all finish this debate of what the feminine form of Amit is, along with many other fun ethnic classifications.

Regulation in capital cities

David Henderson notes that taxicab fares in Washington DC are much lower than anywhere else in the US, and for this he mentions the fact that Congressmen are frequent taxicab consumers in DC, and thus oppose any move to restrict supply, as is the case in other American cities.

But, I tell my students, there is one big counterexample: Washington, D.C. Why? Because Congress has a lot of say over the running of the D.C. government. So here the consumers, whose ranks include Congress and Congressional staffers, have a great deal of leverage over the regulators. Result: No way will Congress cooperate in artificially restricting supply and driving up cab fares that they themselves pay. That’s why cab fares in D.C. have traditionally been so low compared to fares for a given distance and time in other U.S. cities.

By that logic, Delhi and other state capital cities should have great public transport and infrastructure since MPs and MLAs are consumers there, and they wouldn’t want to impose higher costs on themselves. Why hasn’t that happened?

The simple answer is that as far as “government servants” in India are concerned, there is private provisioning of such goods. Thus the state takes care of accommodation and transport for these people. Since they live in a concentrated area, such areas are much less likely to suffer power cuts compared to the rest of the city. If you are a more senior government officer (of the grade of minister or chief minister or prime minister, say), you even get right of way on the roads and are not stopped by traffic.

Because we have elected to solve these problems for “government servants” in India by private provisioning rather than public provisioning, such “servants” are not consumers like anyone else. And thus, their presence in a city has no impact on public goods in the same city!

The finiteness of the global advertising market

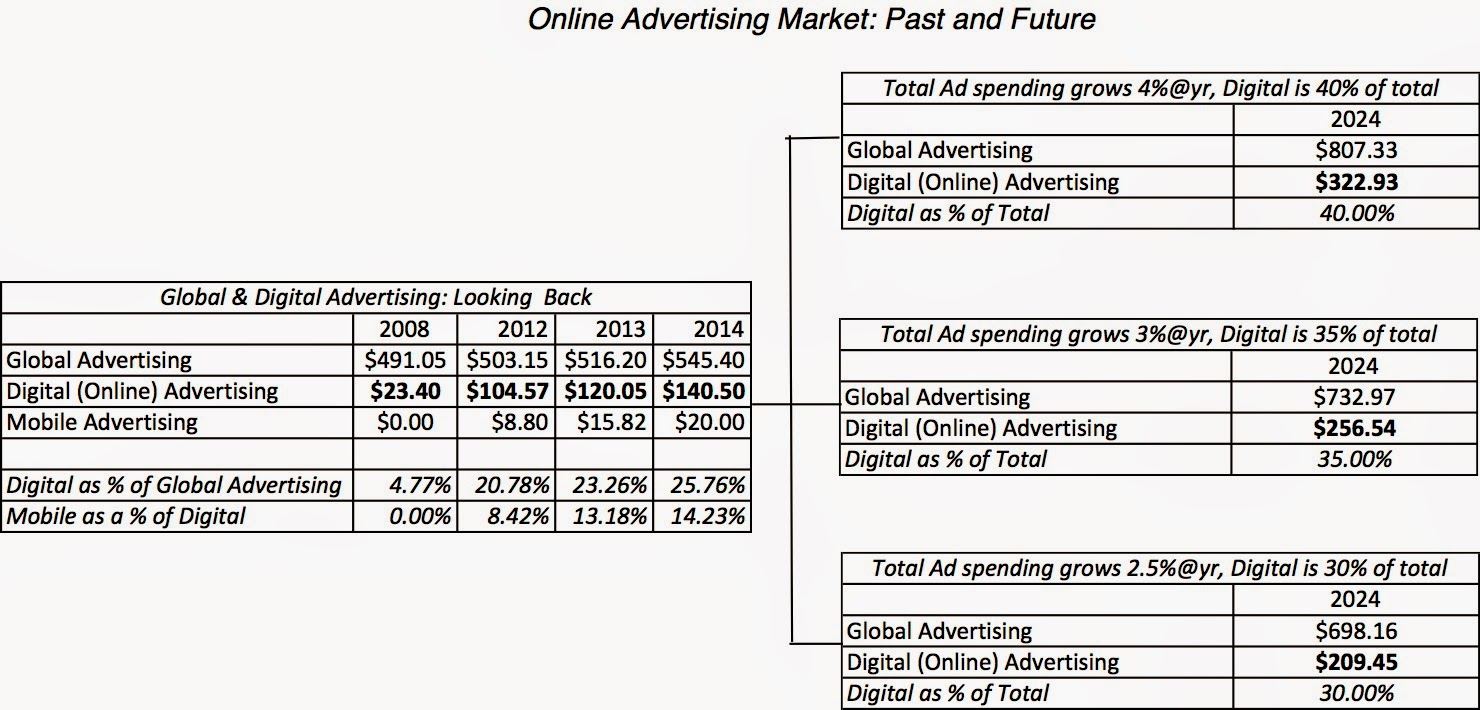
In this excellent post on social media companies, Aswath Damodaran articulates something I’ve long wondered – about the finiteness of the global advertising market. Given the number of companies that come up with new mechanisms to match advertisers with consumers, one can be forgiven for believing that the market for advertising is infinite. That the more avenues you create for serving advertisements to people, the more the advertising that will flow, and there won’t be a let up anywhere.

This picture here is from Damodaran’s blog (which I recommend you subscribe to, since every single post is worth reading). Based on the numbers that Damodaran presents here, the overall growth of the worldwide advertising market seems rather low.

Source: Aswath Damodaran (http://aswathdamodaran.blogspot.in/2014/11/twitters-bar-mitzvah-is-social-media.html). All numbers in billions of dollars

The number to take away for me from this calculation is the shrinking pie of non-digital advertising. Based on these numbers, the total non-digital advertising market in 2008 was $468 billion. In 2014, going by the same numbers this is down to $400 billion. This de-growth is significant and holds important lessons for other sectors that are dependent on advertising.

So far, the flow of advertising capital has been taken for granted and the number of business plans made (in both old and new economies) with an assumption on advertising growth is endless. If you want your local bus utility to make more money, you rent out advertising space on buses. If a low-cost airline wants to make more money, they put advertisements on the back of seats (a very good idea since it gets undivided attention for the duration of the flight). It is a surprise that insides of toilet stall doors (which again get undivided attention) haven’t fallen prey to advertisements yet.

The point here is that while it is all well and good to plan businesses based on advertising income, what we need to keep in mind is that the advertising pie in the long term grows at the same rate as the global economy. Sooner or later the waters will recede to the natural level, and then we will know who is swimming naked!


Perverse regulations

So Uber has tied up with PayTM to process its payments without a second factor of authentication in order to comply with RBI regulations. This is a major win-win for both companies. Uber can now gain access to the part of the relatively affluent Indian population that does not own a credit card (this is a significant segment). PayTM now has a compelling reason to sign up users for its Wallet solution, since all Uber customers now form a sort of a captive audience for this solution.

While discussing this on twitter, someone suggested that once the new Payment Bank regulation is brought in by RBI, wallet solution providers such as PayTM can then set themselves up as Payment Banks.

The problem with that is that if PayTM becomes a payment bank then it will have to comply with RBI regulations of second factor authentication and thus Uber users will not be able to use their PayTM wallets (now accounts) for seamless payment!

#Thatzwhy we need strong regulations.

Baumol Disease Index

In his excellent take on why Rohit Sharma’s 264 is bad for cricket, Niranjan Rajadhyaksha writes about the Baumol’s Cost Disease. This phenomenon, which was first described by William Baumol and William Bowen in the 1960s, describes the increase in cost of labour in industries that have seen little productivity. This has to do with an increase in productivity in other sectors which pushes up the clearing price of labour, which increases the costs of industries that have seen no improvements in productivity.

Based on this, we can construct an index on how industrialised an economy is, which I’m going to christen “Baumol Disease Index”. The basic idea is to pick a sector that is likely to be unaffected by productivity changes over the long term, and look at the median salary of workers in that sector in different countries and across different points in time. This can help us compare the relative levels of industrialisation and productivity in different countries, and in the same country over time.

In order to construct this index, we will take into account one sector which has a lot of “human input” and is unlikely to see much improvement in productivity thanks to mechanisation. My first choice for this was for employees of a company like McDonalds (taking off on The Economist’s Big Mac Index) but then that sector is not that insulated from greater productivity.

We could use the original example that Baumol and Bowen used, which is performing arts, but then performing arts is a winner takes all market – Iron Maiden will be able to command much higher ticket prices compared to the local orchestra thanks to their history and brand and perception of quality. So performing arts is not a great example, either.

Another good choice would be government bureaucrats, since their work is unlikely to be much affected by productivity. But then we’ve had some computerisation and that must have increased some productivity, and ability to be productive and willingness to be productive don’t always go hand in hand!

What about drivers? Despite the efforts towards development of driverless cars, these are unlikely to really take off in the next couple of decades or so, and so we can assume that productivity will remain broadly constant. The other advantage of drivers is that while salaries are tricky to measure (and we need to depend on surveys for those, with mostly unreliable results), taxi fares in different cities are public information, and it is not hard to separate such fares out into cost of fuel, cost of car and cost of driver’s time. This way, measurement of an average taxi driver’s income in different cities and countries, and at different points in time, should not be really difficult.

So, I hereby propose the Baumol Disease Index. It is the per month pre-tax expected income for a driver in a particular city after taking into account costs of fuel and car. This number is going to be imputed from taxi prices. And is going to be a measure of general levels of productivity and industrialisation in an economy. Sounds good?

And while we are on the topic of indices, you should read this excellent leader in last week’s The Economist on the profusion of indices. And since we have a profusion anyway, adding this one additional index shouldn’t hurt! And this one (Baumol Disease Index) measures something that is not measured by too many other indices, and is simple to calculate!

Howzzat?

GM Crops, Kiran Shaw, NN Taleb and Pascal’s Wager

I was a witness to a small discussion on twitter today. It started with Biocon MD Kiran Mazumdar Shaw tweeting this article in the Economist which talks about a massive recent study that indicates that genetically modified crops have “widespread benefits” (disclosure: I’m yet to read that article).

Next, an anonymous tweeter called Sleuth Stock drew the attention of Nassim Nicholas Taleb, former banker, risk scientist and author of Fooled by randomness, The black swan and Antifragile, and a prominent opponent of GM crops to the tweet. This indicated a link to a paper by Taleb that indicates that GM crops have an embedded systemic risk that has not been exposed yet.

Taleb himself then responded to the tweet, with a snapshot of a paper that he is in the process of writing regarding why GM crops are dangerous. The paper is basically a lot of math, with some Greeks, and beyond the reach of this Resident Quant. It was this tweet, by Taleb, mentioning Kiran Shaw, Shekhar Gupta, Devinder Sharma and S Gurumurthy that drew my attention to this discussion.

Then Sleuth Stock responded, saying that people had ignored Taleb when he had talked about systemic risk in banking, and then people started worshipping him when Lehman happened. And now that he is talking about systemic risk in GM crops, we should listen. Bizarrely, Taleb retweeted this tweet (but then some people have the habit of retweeting any faint praise they get on twitter) .

First of all, by Taleb’s own explanations in his first “popular” book Fooled by randomness, that you’ve got a forecast right once in one domain has no bearing on your getting your forecasts right in another situation in another domain. While Taleb had very good reasons to call out the systemic risk in international finance, that the risks he cautioned against were actually borne out has an element of randomness to it. Which is why Taleb’s retweet of Sleuth Stock’s tweet is rather bizarre.

Now that that is out of the way, let us get to GM. Cutting through and ignoring all the math in Taleb’s paper, this is my perception of what the matter is about. The basic idea is genetically modified crops (modified as they now are, rather than by means such as grafting, cross-breeding etc. which has been practiced for millennia) carry an element of risk – we do not know what the probability that they are going to be harmful is, but it is yet to be (and never likely to be, according to RQ) proved to be zero. So there is a non-zero probability (which is known to be small, but whose quantum is unknown) that GM crops might be harmful.

Related to this, it is not known what the potential damage caused by GM crops could be if the risk embedded in them bears out. Given the experiments and trials so far, scientists have not been able to quantify the extent of the damage (however small the probability) that might be caused by GM crops in case of the risks embedded in them being borne out.

The expected value of the “trouble” caused by GM crops can be defined as the probability of trouble multiplied by the extent of the damage caused by such trouble. The trouble (pun not intended) is that neither of these two numbers are well defined. We know that the probability of trouble is small, but only have a very loose upper bound on it, and we will never be able to narrow down the precise probability. We know that the damage caused by the trouble can be potentially large, but we don’t know how large, and we don’t know with what probability the damage can be that large.

When you multiply a small unknown number with a large unknown number, where the order of magnitude of either number is itself unknown, the range that the product of these two numbers can take is rather large. This means that there is a small (and again unknown, but not zero) probability that the costs of introducing GM Crops might be higher than the perceived benefits (as measured by the studies referred to by The Economist). Taleb’s argument is that since such a possibility exists, and the extent of expected costs of GM crops is not known, we should not embrace GM crops.

While it is true that there is a small chance the costs might embrace the benefits, the simple truth is that we don’t know, and we never will know. The probability of the “trouble” is so small, and the possible damage so large that even with a large number of studies and spending long years on it, it is going to be impossible for us to get a handle on either of these two numbers, and consequently the expected value. So the expected value of the “trouble” from GM crops is a classic “unknown unknown”.

Given that this unknown unknown will never even become a known unknown, adoption of GM crops is going to necessarily have, albeit however small, a leap of faith. The question is if we should take this leap. If we are extremely conservative, as Taleb normally is, we would be wary of taking even this small a leap of faith. Given the amount of scientific testing we have gone through already, and the lack of information value in any further testing, though, and the facts of growing world population and the need for food and commodity supply to keep up,  it would be well worth it to make the leap of faith. We should also keep in mind that such a leap of faith when it comes to GM crops is not so much longer than the leaps of faith we have taken while adopting many other scientific advancements. So we should go ahead with GM crops, but know that there is an unknown unknown in the “tail risk”.

Finally where does Pascal’s wager come in? The basic philosophy there is that even if the probability of God’s existence is infinitesimal, His power is so great that if you were not a believer, you shall be damned. The greatness of God’s power, according to the wager, implies that even if the probability of existence of God is infinitesimal, the expected value of being a believer is positive, and hence you better believe!

It is similar to the arguments of the likes of Taleb in the GM case in that potential harmful effects of GM can be so large (and yet unmeasured so far) that even if there is an infinitesimal probability that GM crops might be harmful we should not be adopting them.