Geek Talk

So I was talking to the wife using Viber when Viber acted up and disconnected. This happened a couple of times. Then I moved to FaceTime, but that too had problems, and started acting up. Finally I got irritated and decided I wouldn’t mind spending some money for uninterrupted conversation, so picked up my phone and dialled ISD.

And I told the wife, “I was getting damn irritated with packet switching, so I moved to circuit switching”. And then we got talking on why Viber was so irritating, and we talked about Tanenbaum (both of us really loved that textbook of Networking) and acknowledgements and transmission of messages on unreliable channels – which can only happen by introducing redundancy – which becomes painful in a human-to-human direct conversation.

I have an engineering degree, and am fairly good at maths, and read a fair bit of economics and history, so keep popping up concepts from these in my regular conversation. Some people find it abhorrent, and wonder if I’ve landed from another planet, given that I talk this way. For example, I remember using  the word “incentivise” while answering a question at a quiz (which had nothing to do with economics). I often rationalise purchases saying they offer “option value” – real options are one thing that I think I understand. And so forth.

From this perspective I think it’s really wonderful that I’m married to someone who not only tolerates this geek talk but actively encourages and participates in it! Like the wife has now become a big proponent of the concept of option value (though admittedly she has just joined B-school so is yet to appreciate the finer points of the Black-Scholes-Merton model). I’m not sure if before she met me she would quote as regularly from Harry Potter as she does now (or maybe I’m taking too much credit). And she keeps peppering examples from physics and astronomy and electrical engineering in her normal day-to-day conversation.

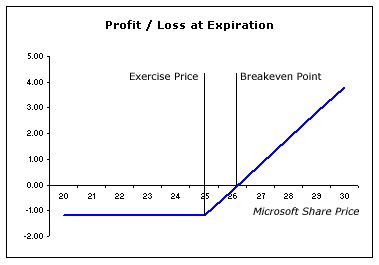
And speaking of physics and option theory and sporting analogies, I get damn irritated when people describe curves as the one below as “hockey sticks”.

I’m Indian, and the only hockey I know is “field hockey”, whose stick looks like a J. So whenever someone mentions “hockey stick” I start imagining a J-shaped curve. As for the above curve, I sometimes (especially when I’m hanging out with banker types) describe it as “call option payoff”. When I’m hanging out with more scientific types, I describe it as “photoelectric effect”.

I wonder how our kids will turn out!

In which I thulp the RBI

I’m still so pissed off with the Reserve Bank of India doing a Ramanamurthy that I’ve written a serious editorial in Pragati – the Indian National Interest Review (published by the Takshashila Institution). In this piece I take on measures by the RBI to limit ATM transactions and the thing on two factor authorization.

I claim that both these decisions are economically unsound and there is only possibly a farcical explanation for them:

There is perhaps only one idea (more a conspiracy theory) that possibly explains the above decisions from the RBI. Both these decisions, it might be noticed, help push up the usage of hard currency and decrease the levels of bank deposits. Less bank deposits means less money available for banks to lend out, which means that the cost of borrowing from a bank implicitly goes up. Could it be that the above regulations are a move by the RBI to curtail money supply without necessarily doing the politically tricky task of raising interest rates?

If it is (and it is a very remote possibility), we should commend the RBI for what will then amount to be a sneaky decision

Link

Why Keynes’s prediction has not come true

Writing in the 1930s economist John Maynard Keynes predicted at at the “time of our grandchildren” (figurative term since he himself had no kids) people would live a life of leisure and work for an average of fifteen hours a week. Yet, it’s been eighty years since and we still slog away, putting in anywhere between forty and sixty hours a week as we earn our living. And it doesn’t look like things are going to change soon

So why did this happen? I propose two reasons. When I quit my first job almost eight years ago within three months of joining I complained that the workload was way too high. I added that I didn’t need all the money that job paid me and wouldn’t mind taking up something that paid half the money and where I had to work only half the time. No such thing materialized and I slogged away, before going freelance two years back.

Now why does this little anecdote matter? I’m using this to show that the returns to work are not linear. If you were to plot the number of hours worked per week on the x axis and the total value added on the y axis you are likely to get a convex function. In other words the marginal benefit out of every additional hour you work per week is an increasing function of how much you’ve already worked.

The question is why this is so. One simple answer is that in jobs with a high degree of learning by working longer you end up learning faster. Then within the job you can have network effects where the work you do in one part of the job can help you do another part better (I constantly see this in my freelancing where I work on several projects at a time). If there is a steep learning curve it is easier for the firm to appoint one worker to work sixty hours a week than two to work thirty each – since the starting costs get saved. And so forth.

So this increasing returns to effort (in terms of the hours worked) is that the trade off between work and leisure gets resolved in favour of leisure only at a very high level of work – where you are working close to capacity and don’t want to risk burnout and want to maintain your sanity. Before that the increasing returns to effort means that you are likely to put off leisure in favour of “just a little more work”.

The question is if all jobs work this way, and why an economist as brilliant as Keynes didn’t see this concept of increasing returns to work. The answer is that increasing returns to work applies only to a certain kind of jobs – jobs that require a high level of skill and learning and which can be broadly classified as “knowledge jobs”.

Back in Keynes’s time such knowledge jobs were few – far fewer than they are today. Most workers were in jobs that didn’t require a high degree of skill or learning. In unskilled jobs or jobs that are physically demanding the expanding returns to effort part of the curve is extremely short. Once you have figured out the best way to bolt together two metal pieces doing more of this job is not going to make you much faster in bolting together two metal pieces.

Instead since it is physical after you’ve put in a certain number of hours in a day you begun to tire and become less efficient (notice this point occurs at a later stage for knowledge jobs). And the returns to hours curve starts flattening out much sooner. If you were to do the trade off with leisure using such a curve the equilibrium might occur much earlier than for knowledge work – perhaps at Keynes’s predicted value of fifteen hours per week.

Now even today while the proportion of non knowledge jobs is smaller than eighty years back the number of people doing such jobs is not small. So if the work-leisure equilibrium happens at fifteen hours a week why do people work longer?

The answer is that work-leisure is not the only equilibrium one is solving for. You also need to work enough to be able it fund your living. And it has happened that fifteen hours of non knowledge work pays nowhere close tO what is required to fund a reasonable living. For this reason non knowledge workers are forced to work much longer than their work-leisure equilibrium rule permits!

So why didn’t Keynes see this? I think what he missed was the boom in the knowledge economy in the postwar period. With the rise in the knowledge economy what you had was a set if jobs that had increasing returns to effort. Moreover these returns, on an hourly basis, were far larger than the returns on a non knowledge job. The boom in the knowledge economy meant that people working in such jobs impacted general prices and this forced the non knowledge workers to work longer!

So we have the unique situation now that those people who can afford to work for only fifteen hours a week have no incentive to do so. On the other hand people who have an incentive to work no more than fifteen hours a week are forced to work longer because otherwise they cannot find their lives!!

An economic view of state splits

Most commentators prefer to couch the Andhra Pradesh split in emotive terms – the people of Telangana thought they were being treated in an inferior manner by the people of Andhra, and hence wanted to break away to form a separate state, and that the people of the Rest-of-Andhra (RoA) did not want the split because of reasons of Telugu pride. This is wrong, and over-complicates the issue.

Insight: When something can be explained with simple economic reasoning, looking for other (emotional/psychological/social/…) reasons is futile.

Telangana is the region of Andhra Pradesh that had been part of the Hyderabad state (RoA was part of the Madras Presidency). Due to differing standards of governance in the “Provinces” and the “Princely States”, at the time of independence, Telangana was backward compared to RoA. It didn’t help matters that Telangana was at the receiving end of brutality by the Nizam’s Razakars during the year or so when Hyderabad state was not yet part of India.

Given the vastly differing levels of development in Telangana and RoA, and the differing cultural backgrounds, I’m not sure it made economic sense to unite them in the 1950s. Potti Sriramulu’s fast and subsequent death, however, turned the issue emotive, and there was no room for rational reasoning. And a united Andhra Pradesh was created in 1956. In any case, it was consistent with the mantra of the day to have linguistic states – administrative unwieldiness be damned.

Unless there is a concerted effort, in the natural order of things, when you have a rich part  and a poor part of a particular state or country, the rich part can be expected to grow faster than the poor part – no malice here, it is simple network effects. Andhra Pradesh was no exception to this rule, and soon Telangana was much more backward than RoA.

The state splits in 2000 when Uttarakhand, Jharkhand and Chhattisgarh were formed shows that richer parts of states usually don’t mind letting go of the poorer parts. This is especially true if there is a feeling that taxes collected predominantly from the richer parts are being used to disproportionately fund the poorer parts. There might be some emotional attachment, but economics usually rules. Then, why is it that there is so much opposition to hiving off the poorer parts of Andhra Pradesh?

Andhra Pradesh has this unique situation where the capital city (and by far the biggest city) Hyderabad is located in the poorer portion. Hyderabad being the capital city saw significant investments from people from all over Andhra Pradesh, including RoA. A significant portion of RoA investment in Hyderabad is in real estate. Now, with real estate regulation being a state subject, people normally don’t want to hold too much real estate investment outside of their home states – since they will have no control over the politics of those states. So RoA investors are freaking out that their long-term investments in Hyderabad will soon be in a different state.

In a situation such as this, prudent investors might want to pull out (rather than risk their capital in a neighbouring, and possibly hostile, state). However, the problem is that none of the investors want to set off a downward price spiral in Hyderabad. Think of the situation as one where investors from RoA are invested, but know other investors are wanting to pull out any time. But you don’t want to start the process of pulling out, since that can reduce the value of your other holdings. So you stay invested. And hope that the bubble will never burst.

The attempt by people of RoA to hold on to Telangana (Hyderabad, specifically, they don’t really care about the rest of Telangana), is an attempt to save their capital locked up in investments in Hyderabad. If Andhra Pradesh doesn’t split, nobody from RoA will want to pull out their capital from Hyderabad, and the drop in value won’t happen.

It must be pointed out here that the Congress Party’s solution of having Hyderabad as a joint capital for a number of years is unlikely to be much compensation, if Telangana holds jurisdiction over Hyderabad territory anyway. The capital of RoA investors in Hyderabad will still be under risk in that case. The other option proposed was to make Hyderabad a Union Territory,  but that wouldn’t help either – since the influence of RoA in the politics of Hyderabad would still be minuscule.

To summarize, the reason RoA doesn’t want to let go of Telangana is because they don’t want to lose political control over their own investments – in the city of Hyderabad. Issues such as “state pride” and “Telugu pride” are secondary – they have been drummed up just to get the support of the non-elite who may not be economically affected by the state division. In fact, if Telugu pride were so important why in the first place would the Gults of Telangana want a separate state?

From a policy standpoint, it is important to not let the discourse of language pride get into the way of forming smaller states. The only reasons that should matter should be economics and administrative efficiency.
 

Baptists and Bootleggers: Karnataka Edition

“Baptists and bootleggers” is a popular concept in economics. It is used to illustrate that in the absence of sound economic thinking, good intentions don’t count for much. According to this concept, baptists want to ban the sale of alcohol on Sundays because it is the day of the lord, and they don’t want people to be drinking that day. And this plays out directly into the hands of bootleggers – who make a living supplying people their booze on Sundays.

So by calling for the sale of liquor to be banned on Sundays, baptists are essentially encouraging an illegal activity and an illegal trade. If not for the baptists, people would be able to buy their liquor legally on Sundays, and bootleggers would be out of business.

There is also a social cost to policies like this – by pushing an activity (such as the sale of liquor on Sundays) underground, you encourage nefarious elements to get into business, rather than keeping it in clean hands. And this is likely to increase the overall rate of crime.

Thus, by their supposedly moral position that alcohol should not be sold on Sundays, baptists actually end up unintentionally encouraging crime!

A similar story to this has been playing out in Karnataka in the last twenty years. For whatever reason, in 1993, the government of Karnataka decided to freeze the total number of liquor licenses in the state. Since 1993, if you want to open a bar or a liquor shop, you need to purchase a license from the secondary market. Effectively, for every new liquor outlet, some outlet somewhere in the state has to close down (whether such closure is usually voluntary or not is left as an exercise to the reader). This increases the cost of liquor intermediation in the state and leads to higher prices for the consumer.

While higher prices may be desirable for “sin goods” such as liquor, there is a better way for the government to increase consumer prices – by levying higher taxes, which ensures that the additional money thus paid by the consumer flows into the government coffers. By limiting the number of licenses, however, the government doesn’t get extra revenue.

Instead what this encourages is illegal sale of liquor! That there is a limit on the number of liquor licenses doesn’t push down people’s need for liquor. And they end up buying liquor from illegal sources and bootleggers, and it becomes difficult to maintain quality and hygiene standards on such sales. And with a bar having to close down for every new one that needs to open, you might imagine the kind of characters that might get involved in the process.

Back in 2008, a friend was trying to start a lounge bar, and he mentioned that he had to pay up to the tune of Rs. 30 lakh to get his license, while the official price is about a tenth of the amount. It is obvious that not all the money he paid for his license went to the government’s coffers.

Where do the baptists come here? Because every time there is a proposal to increase the number of liquor licenses, you will have a wave of morality which protests this decision. They are the baptists who keep Karnataka’s bootleggers in business.

Also read this piece on the funny rules of Karnataka’s liquor licensing regime.

Why the rate of return on insurance is low

I’m currently doing this course on Asset Pricing at Coursera, offered by John Cochrane of the University of Chicago Booth School of Business. I’m about a fourth of the way into the course and the beauty of the course so far has been the integration of seemingly unrelated concepts. When I went to business school (IIM Bangalore) about a decade ago, I was separately taught concepts on utility functions, discount rates, CAPM, time series analysis and financial derivatives, but these were taught as independent concepts without anybody bothering to make the connections. The beauty of this course is that it introduces us to all these concepts, and then shows how they are all related.

The part that I want to dwell upon in this post is the relationship between discount factors and utility functions. According to one of the basic asset pricing formulae introduced and discussed as part of this course, the returns from an asset is a positive function of the correlation between the price of the asset and your expected consumption growth. Let me explain that further.

The basic concept is that one’s utility function is concave. If you were to plot consumption on the X axis and utility from consumption on the Y-axis, the curve would look like this:

In other words, let us say I give you a rupee. How much additional happiness would that give you? It depends on what you already have! If you started off with nothing, the additional happiness out of the rupee that I gave you would be large. However, if you already have a lot of money, then the happiness you would derive out of this additional rupee would be much lower. This is known in basic economics as the law of diminishing marginal utility, and is also sometimes called the “law of diminishing returns”.

So, let us say that tomorrow you will either have Rs. 80 or Rs. 120 (the reason for this difference in payoff doesn’t matter). Let us call these as states “A” and “B ” respectively. Now, suppose I’m a salesman and I offer you two products. Product X  pays you Rs. 20 if you are in state A but nothing if you are in state B. Product Y pays you Rs. 20 if you are in state B and nothing if you are in state A. Assuming that you can end up in states A or B with equal probability, which product would you pay a higher price for?

The naive answer would be that you would be indifferent between the two products and would thus pay the same amount for both. However, rather than looking at just the payoffs, you should also look at the utility of the payoffs. Given the concave utility function, you would derive significantly higher happiness from the additional Rs. 20 when you are in State A rather than in State B (refer to appendix below). Hence, you would pay a premium for product X relative to product Y.

Now, from a purely monetary perspective, the payoffs from X and Y are equal. However, you are willing to pay more for product X than for product Y. Consequently, the expected returns from product X will be much lower than the expected returns from Y (define returns as frac {payoff}{price} - 1. Hence, for the same payoff, the higher the price the lower the returns). Keep this in mind.

Now let us come to insurance. Let us take the example of car insurance. Most of  the time this doesn’t pay off. However, when your car gets smashed, you are compensated for the amount you spend in getting it fixed. What should be your expected return from this product?

Notice that when your car gets smashed, you will need to spend money to get it repaired. So at the time of your car getting smashed, the amount of money (and consequently consumption) is going to be lower than usual. Hence, the marginal utility of the insurance payout is likely to be higher than the marginal utility of a similar payout at a point in time when your consumption is “normal”. This is like product X above – which gives you a payoff at a time when your consumption level is low! And remember that you were willing to expect lower returns from X. Similarly, you should be willing to expect a lower rate of return from the insurance product!

Technical Appendix

A standard utility function used in finance textbooks is parabolic. Let us assume that for a consumption of C, the utility is - (200-C)^2. The following table shows the utility at various levels of consumption:

Consumption          Utility
80  (A)                  -14400
100                        -10000
120  (B)                 -6400
140                        -3600

Notice from the above table that getting the payoff of 20 when you are at A increases your utility by 4400, whereas when you are at B, the payoff of 20 increases your utility by only 2800. Hence, your utility from the payoff is much higher when you are at A than at B. Hence, you would pay a higher price for product X (which pays you when your consumption is low) than product Y (which pays you when your consumption is already high)


Banking activity and economic activity

Out on Capitalmind, Deepak Shenoy has an excellent post on the penetration of banking services in India, where he points out that 30% of all bank deposits in India are in Mumbai and Delhi. I encourage you to read that post in full.

Having read that, I was interested to see the per capita figures and compare them across states. On a whim, I decided to compare that to per capita state GDP and this is what I got:

Data source: RBI website Note: Maharashtra, Delhi and Goa have been left out because they are outliers. Some other states (Chandigarh, Gujarat and Mizoram) have been left out since their latest GSDP figures are not available
Data source: RBI website
Note: Maharashtra, Delhi and Goa have been left out because they are outliers. Some other states (Chandigarh, Gujarat and Mizoram) have been left out since their latest GSDP figures are not available


While the direction of causality cannot be clearly established, this clearly shows that banking penetration is highly correlated with economic activity.

India State Wise Road Density

Roads are one of the strongest measures of economic activity. The denser the road network in a particular area, the easier it is for people in the area to connect with and trade with each other, thus leading to a higher degree of economic activity. The graph here compares the length of roads across Indian states in 2011.

Source: Statistical Year Book India, 2013


It would also be interesting to see how different states compare in terms of addition to road length between 2009 and 2011. The graph here shows the CAGR (compounded annual growth rate) in total length of roads in each state between 2009 and 2011.

Source: Statistical Year Book India, 2013

Wine buying

Today, for the first time ever, I went out to buy wine, and in hindsight (I’m writing it having finished half of half the bottle) I think I did a pretty good job.

I had gone to this “Not just wine and cheese” store in Jayanagar hoping to pick up some real good wine to go with our cooking experiments for the evening (we’re making pizza and pasta). Having had really bad experiences with Indian wines (Nine Hills, Grover’s, Sula), I gave them a wide berth and moved over to the international section. The selection wasn’t particularly vast, and interestingly as soon as I moved over to the international section, one of the shopkeepers came over to assist me.

He first showed me a 2009 wine from France, when i asked him to show something older. For a slightly higher price, he pulled out a 2006 wine from France. The pricing seemed suspicious to me. A six year old wine from France, one of the more sought after wine-producing countries, for just Rs. 1600 (inclusive of 110% tax, so the duty free dollar price comes to around $15)? May not be very good wine, I reasoned, and now I decided to let go of all details on production date, etc. and simply asked the shopkeeper to recommend to me a good bottle.

Maybe it was the fact that I had quickly moved over to the international section, or that I was talking about year of bottling, but the shopkeeper assumed I was a rather serious buyer, and enthusiastically recommended to me a few bottles. Now, picking wines is tougher than picking whiskeys (where it’s easy to have favourite brands. Mine, if you would ask, is Talisker). Each country has several estates, the year of bottling, weather in the country in various years and several other factors go into determining how good a bottle is. Also, there’s inverse pricing, where you perceive more expensive wines to be better. So one has to look upon raw economics skills in order to judge wine bottles and pick something that is likely to be good.

What particularly interested me was a bottle of 2010 wine from Chile. Now, at Rs. 1300, it seemed rather highly priced for its vintage (given that France 2006 went for 1600). And then, I realized that Chile is a rather unfashionable wine producer, since most people tend to prefer European wines, and that being in the temperate weather zone, it is capable of producing good wines.

The shopkeeper mentioned that the particular bottle had been procured after a customer had specifically asked for it, and that it was made of superior quality grapes. Now, given that it was a wine of recent vintage and from an unfashionable producer, that it cost almost as much as a much older wine from a much older vintage told me something. That it was likely to be good.

It’s about two hours since I got home, and the bottle is half empty. The wine has been absolutely fabulous, and I hope this is the beginning of a great wine-buying career.

Sensitivity

This post is not about any statistical analysis. Neither is it about people’s sensitivity about others, which is associated with empathy. This post is about what I can, incorrectly but more specifically, call “self-sensitivity”. About people who are really thin-skinned and who are likely to “feel bad” at the drop of a hat. I argue that as far as social impact goes, it is no better than arrogance. For purposes of the rest of this post, the word “sensitivity” is to be read in this context – about sensitivity towards one’s own feelings.

A number of people see sensitivity as a positive trait. “Oh, she’s such a sensitive person” is usually bandied about as a compliment to the sensitive person. One is supposed to feel some sort of sympathy to the sensitive people, and remain sensitive (!) to their feelings while interacting with them. It somehow so happens that, more often than not, sensitive people also happen to be nice, and it is as if in return for this niceness you need to take extra care of them.

Thinking about it, sensitivity arises thanks to some deep-rooted insecurity, or some kind of inferior complex. This insecurity means that the person is more likely to associate some kind of malevolent intent to the counterparty’s words or actions, leading to much disagreement and tears and loss of trust. While it is okay for a sensitive person to expect counterparties to be sensitive to their sensitiveness (!), it needs to be understood that over the long run, this could cause friction and be counterproductive to the cause of the relationship.

The problem with both sensitivity and arrogance is that it increases the effort involved in talking to a person. If you talk to an arrogant person, you need to put up with his/her arrogance and the possibility that he/she might put you down for no fault of yours. You need to be always prepared for the conversation to go unpleasant, and thus overall your costs of conversation go up, which as a student of economics, you will understand, decreases the total amount of conversation.

While arrogance is a well-known cause of friction in conversation, less understood is that sensitivity can also have a similar impact. While dealing with a sensitive person, you may not be required to be prepared to be humiliated, or for the conversation to go really bad. However, at all points during your conversation, you will need to keep in your head that the counterparty is extra-sensitive, and that means you have a constant background process that censors your speech, and makes sure you don’t hurt the counterparty. This can again have an adverse impact on the conversation itself, and might tire you out quickly. Again, simple economics tells us that it affects quantum of conversation adversely.

While in the short run, it is okay for sensitive people to ask people around them to be aware of their sensitivity, expecting similar support in the longer run, while making no effort on one’s own part to get rid of one’s insecurities or inferiority complex, is not fair on the part of the sensitive person. Like arrogant people, sensitive people need to understand that their sensitivity is a cause of friction and it can affect their relationships in the longer run; and they need to work on it.

Unfortunately, sensitivity is seen as a largely positive trait, mostly by people who are unaware of the friction it can cause. More importantly, how do you tell a sensitive person that he/she should be less sensitive while at the same time not hurting him/her? In that sense, dealing with arrogant people is simpler – you can speak your mind to them without much long-term impact, and the general understanding of arrogance in society means that it is easier for you to at least make an attempt to tell an arrogant person to be less arrogant.

But how does one deal with sensitive people? Who will bell the cat?