Analyzing the IPL Auction Rules – 1

So finally after a really long delay the rules for the IPL Auction 2014 are out. Each franchise has the option of retaining up to five players, with additional “trump cards” that allow them to match the price of a winning bid in the auction for players that were part of their teams in the earlier IPLs.

At the outset, the rules of the auction look loaded towards teams that already have strong squads and want to retain as many players as they can – for example, given the rules of the auction, a team can retain up to 6 players from their existing squads, and this significantly biases the auction in favour of teams that want to retain players.

Looking a bit deeper, though, it is clear that this luxury of retention comes at a price. For example, irrespective of what the team negotiates with its number one player, Rs. 12.5 Crore (125 million), or a little more than 20% of the cumulative salary cap will be debited from the team’s account. For the next player, Rs. 9.5 Crore (95 million) will be debited. There is a sliding scale and the fifth player a team retains will cost them Rs. 4 Crore in terms of their budget.

The question is if this pricing is appropriate – is charging 20% of the team budget for the number one player enough compensation for the benefit the team gets by way of retention? Is charging two thirds of the total salary cap (Rs. 39 Crore) enough for retention of five players?

At first look, this pricing looks appropriate – after all, why would someone want to forego two thirds of their auction kitty for keeping just five players, when the total squad size is 16 to 27? However, looking at the previous auctions tells a different story.

The two graphs here shows the proportion of total auction money spent by each team on each player in the last two auctions. The graph might appear complicated so let me explain. For each team, I ordered players bought in the auction in the descending order of price. Then I looked at how much the top player cost as a proportion of the total money spent at the auction. Then, how much the top two players cost and so on.

ipl08


ipl11


(click on images for full size. For the 2008 auction, marquee players have been included in the analysis)

In the 2008 auction, teams spent between 60 and 85% of their budgets in order to select their five most expensive players, with a median of 72%. In the 2011 auction, teams spent between 65 and 90% of their budgets for their top five players (takes into account retained players), and the median spend was 71%. 

Given that the “top 5” players for each team cost them upwards of 70% of their total budgets in the last two auctions, charging teams only Rs. 39 Crore (65%) for retaining five players is blatantly unfair, and biased towards the teams that want to retain. Also, considering that retained players are “known devils”, there is more value for money for teams from retained players. So in the ideal case, the fee for retaining 5 players should have been definitely upwards of 75% of the total budget (Rs. 45 Crore).

The following table helps to show the undervaluation of each retained player:
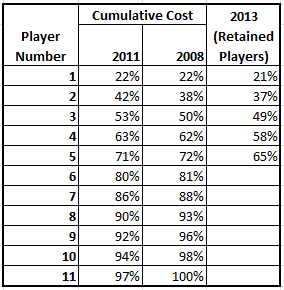
costmatrix


The second and third columns in the above table shows the median percentage of total budget teams spent in order to buy their top N players. The last column shows what percentage of their budget they would have to spend if they are to retain players in the auction.

The message for teams is clear: retain as much as you can. It is cheaper to retain your top players rather than building a new team from the available pool. The challenge, however, is to negotiate a good price with these players.

PS: I have a solution that can help teams plan their auction strategy. If you are an IPL team and you are interested in this, contact me through the contact form.


The Question About Adarsh No One Is Asking

Nikhil Service Station is one of the more popular petrol bunks in South Bangalore. If you wonder why you have never heard of it, however, it is because nobody refers to the petrol bunk by its real name. The bunk is owned by Anitha Kumaraswamy, wife of former Karnataka Chief Minister HD Kumaraswamy and daughter-in-law of former Prime Minister HD Deve Gowda. The service station came into service in the early 2000s. It had been allotted by Indian Oil in the “Kargil martyrs” quota. It is now a landmark in South Bangalore, and popularly known as “Deve Gowda Petrol Bunk”.

The reason I’m bringing up the issue of the petrol bunk is to draw a parallel with the scam-ridden Adarsh Cooperative Housing Society in Mumbai, which was again ostensibly built for “serving and retired army personnel”. The Adarsh scam is in the news once again due to the rejection of the report by the Maharashtra cabinet and the connection with arrested diplomat Devyani Khobragade.

The question about Adarsh that nobody is asking is this – why is it the government’s business to construct housing for “serving and retired army personnel”? Why is it that the government should compensate families of martyrs with petrol bunks and LPG dealerships and not cash? Aren’t these structures designed to be scammed?

Nobody argues that the army must be paid well. Nobody argues, either, that army personnel should be generously insured and compensated, given the hazardous nature of their jobs. My argument, however, is that this insurance and compensation should be universal and standardized. Allotments such as housing and LPG dealerships are discretionary by nature, and that makes them prone to abuse.

Consider for example, a housing society the government constructs for “serving and retired army personnel”. Let us say that the society has 500 apartments. How does the government choose who gets these apartments? And in what way are the 500 such chosen personnel different from those that did not get the allotment? Does this discretionary allotment not leave the system to abuse? Does this not lead to unhealthy competition among the “serving and retired army personnel”? Do we want that in our armed forces?

On a similar note, after each railway accident, we have the railway minister announcing a discretionary compensation for the dead and injured. The question is why this should be discretionary. Cannot the railways simply buy group insurance for all its passengers, which is automatically paid out upon an accident?

The argument I’m making is that some of  the processes we follow are designed to be scammed. In the time of tragedy, either in an accident or in battle, what we need is a standardized and predictable response on behalf of the government agencies. By not putting that in place, the system is prone to abuse.

On finding the right signal

It is not necessary that every problem yields a “signal”. It is well possible that sometimes you try to solve a problem using data and you are simply unable to find any signal. This does not mean that you have failed in your quest – the fact that you have found the absence of a signal means is valuable information and needs to be appreciated.

Sometimes, however, clients and consumers of analytics fail to appreciate this. In their opinion, if you fail to find an answer to a particular problem, you as an analyst have failed in your quest. They think that with a better analyst or better analysis it is possible to get a superior signal.

This failure by consumers of analytics to appreciate that sometimes there need not be a signal can sometimes lead to fudging. Let us say you have a data set where there is a very weak signal – let us say that all your explanatory variables explain about 1% of the variance in the dependent variable. In most cases (unless you are trading – in which case a 1% signal has some value), there is little value to be gleaned from this, and you are better off without applying a model. However, the fact that the client may not appreciate you if you give “no” as an answer can lead you to propose this 1% explanatory model as truth.

What one needs to recognize is that a bad model can sometimes subtract value. One of my clients once was using this model that had been put in place by an earlier consultant. This model had prescribed certain criteria they had to follow in recruitment, and I was asked to take a look at it. What I found was that the model showed absolutely no “signal” – based on my analysis, people with a high score as per that model were no more likely to do better than those that scored low based on that model!

You might ask what the problem with such a model is. The problem is that by recommending a certain set of scores on a certain set of parameters, the model was filtering out a large number of candidates, and without any basis. Thus, using a poor model, the company was trying to recruit out of a much smaller pool, which led to lesser choice for the hiring managers which led to suboptimal decisions. I remember closing that case with a recommendation to dismantle the model (since it wasn’t giving much of a signal anyway) and to instead simply empower the hiring manager!

Essentially companies need to recognize two things. Firstly, not having a model is better than having a poor model, for a poor model can subtract value and lead to suboptimal decision-making. Secondly, not every problem has a quantitative solution. It is very well possible that there is absolutely no signal in the data. So if no signal exists, the analyst is not at fault if she doesn’t find a signal! In fact, she would be dishonest if she were to report a signal when none existed!

It is important that companies keep these two things in mind while hiring a consultant to solve a problem using data.

Maratha Names

Going by Uday Kulkarni’s book Solstice at Panipat which I’ve been reading over the last few days, there was a Maratha chieftain named Balwant Rao Mehendale. He was supposed to be a brilliant warrior and led one of the divisions of the Maratha army. However, in a skirmish about a month before the big battle, he was hit by a bullet and perished.

What I found amusing is his son’s name – “Appa Balwant”, which translates into Kannada as “father Balwant”. The name amuses me because it is as if the child wasn’t given a name. Whenever someone would ask for his name, he would simply say “Appa Balwant” (“my father is Balwant”). Wonder how it affected him!

Thinking more about it, though, it is possible that the kid’s given name was “Appa” (since Marathis use father’s given names as middle names) and so his full name was “Appa Balwant Mehendale” or something of the sort.

It continues to amaze, however, that someone would name their kid “Appa”.

Afghanistan

While reading the book Solstice at Panipat by Uday Kulkrani over the last few days, I came across an interesting factoid – Afghanistan as a nation didn’t exist until around 1750, which was when the Persian Shah Nadir Shah was assassinated and the Afghan tribal chiefs got together in a “Loya Jirga” (Grand Assembly), where with the recommendation of a Pir, Ahmad Shah Abdali was made king, and given the title Durr-e-durrani (pearl of pearls).

Even during Abdali’s rule, Afghanistan was not particularly united but was only a loose federation of small tribal states. The country wouldn’t become “united” until the 19th Century when both the Russians and the British sought to develop it as a buffer state as part of the great game.

Given this background, it is no surprise that it has been virtually impossible to impose a National Government in Afghanistan without the support of foreign powers. Will be interesting to see what happens to the country after the US withdraws next year.

Vegetables in Indian vegetarian food

A number of my long-time meat eating friends have told me about the lack of vegetables in the traditional Indian vegetarian diet. Back then I wasn’t so sure, as we used to get plenty of vegetables at home, and use them in every meal. However, lunch yesterday suggested that there might be some truth to this statement.

We had lunch at Nandhini, part of a chain of Andhra-style restaurants in Bangalore. The wife had “meals” while I had a biryani. Apart from this we ordered a chicken starter. What struck me as we ate was that neither of us was eating any vegetables.

The biryani, since it contained meat, didn’t have any vegetables, save the odd onion. The raita accompnaying it had onion and cucumber. The “meals” consisted of rice, dal, chutneys, gunpowder, rasam, curd and a sweet (none of which have vegetables – notice). Then there was sambar (whcih had the odd vegetable piece floating about) and a dry curry with an over-boiled vegetable. Hardly enough vegetable for a meal!

Considering that what we had yesterday is representative of the typical Andhra meal, there is perhaps some truth to the statement that Indian vegetarian food doesn’t have much vegetable.

Analyzing Bangalore’s Growth

Banglore’s population has grown 20-fold and area 10-fold since 1941, going by this chart (via Gautam John on Facebook, photo taken at MG Road Metro station).

Bangalore Population and Area

What would be interesting to see is when the spurt in Bangalore population actually happened. Checking that is quite simple. Using the population figures from the census, we can derive the CAGR (compounded annual growth rate) of the population in each decade. This is presented in the chart below:

bangalorepop

Conventional wisdom is that Bangalore was a sleepy little city until the “IT revolution” happened around the turn of the millennium after which the city exploded. The chart above calls that wisdom into question. While the annual growth rate of Bangalore’s population has been higher in the noughties compared to the earlier two decades, this is by no means the period of Bangalore’s fastest growth.

Bangalore grew fastest in the 1940s, perhaps because it was made capital of Mysore State after independence, thus leading to the arrival of a large number of government servants in the city. Interestingly, the next period of high growth in the city was in the 1970s, which was even before the seeds of the IT revolution had been sold (the setting up of the Texas Instruments office in Bangalore in the early 80s is regarded as the beginning of Bangalore as an IT hub).

What might have led to the perception of Bangalore’s growth being fastest in the noughties is that the strain on a city’s infrastructure is a superlinear function of the city’s population. And with a lot of the city’s infrastructure having been stagnant over the years, the strain started getting really noticed in this decade.

Identifying Groups of Death

The Guardian has an interesting set of graphics trying to identify the “Group of Death” at the forthcoming (2014) football World Cup. They have basically ordered groups and teams on three counts – something called as “strength of schedule” (how it is calculated is not explained), average strength of each group (mean rating points) and the strength of each match (sum total of rating points of the teams playing). They don’t actually go on to identify which the groups of death are. 

Another piece in the same paper gives a history of the concept of the Group of Death, and tries to explain why some groups can be classified so while others cannot. So in this post we will focus on precisely that – once a draw has been made, how do we identify groups of death? Without loss of generality, let us restrict our analysis to groups of four teams from which two qualify for the next round following a round robin (the format the World Cup uses). We will also restrict ourselves to analyzing the group stage and ignore chances of “death” in the knockout stages.

A “group of death” traditionally refers to a group where at least one “favourite”  team gets knocked out. Assuming that a team with higher odds of winning the tournament is likely to beat one with lower odds, a group of death is necessarily one that contains at least three teams that are “favourites” to win the tournament.

From this, one way to measure groups of death is to order teams in decreasing order of odds of winning based on a reputed bookie’s odds, and then see how closely the top three teams of a group are clustered. The closer three teams are to each other, the closer the group is. We can use a distance metric to measure this.

Another simpler method is to see the odds of the third team in a group winning the world cup. The groups where the third best odds of winning are the groups of death! Again this is a relative metric since if each group has two “strong teams” and two “weak teams” there is effectively no group of death (hence the earlier metric trumps this one).

Another way to identify how deadly the groups are is to use bilateral odds for each match, and to identify the odds that the two “seeded teams” in a group both don’t qualify. For example, Group B has Spain, Netherlands, Australia and Chile, with the first two being the “seeded teams” (given their ranking). Now, we can calculate the probability that at least one of Spain and Netherlands doesn’t qualify. That gives the “death rating” for this group. The group for which this “death rating” is highest is the group of death.

As you can see, there are several ways for identifying the group of death. Unfortunately, none of the analysis that the Guardian has put out contributes to this. Let us now look at a couple of methods for ourselves. For the purpose of analysis I’m using the easiest available odds, which are from the Bleacher Report. Ideally, for this analysis we should be using odds before the draw was made – since the draw itself would have ended up adjusting odds. Nevertheless, since this is for illustrative (rather than predictive) purposes only, we’ll stick to the current odds.

Let us start with the easiest method, which is the odds of victory of the third best team in the group. Based on the Bleacher odds, the third best teams in each group are likely to be :

A Mexico 150/1
B Chile 33/1
C Japan 150/1
D England 28/1
E Ecuador 150/1
F Nigeria 250/1
G United States 150/1
H South Korea 150/1

Two teams stand out – Chile at 33/1 and England at 28/1. Based on this metric, the group of death is Group D (Italy, England, Uruguay, Costa Rica). The Guardian might say that Australia, Ghana or the United States might have the toughest draw, but the odds of each of them winning is so low that it doesn’t matter that they have tough draws!

Let us now use another metric – the difference between the odds of the second and third placed teams in each group. One metric of the group of death might be where this difference is the minimum (this metric has the problem of classifying groups with one clear winner as groups of death, while they technically are not).

And this metric identifies Group F (Bosnia, Nigeria)  and Group A (Croatia, Mexico) as groups of death. You might notice that these are Argentina and Brazil’s groups respectively and those two teams are expected to sail through, so this is not a good metric.

Next, let us involve the top three teams of each group (to prevent the above anomaly) and look at the sum of the absolute difference in odds. For example, if the odds of the top three teams in a group are o1, o2, o3, we will measure each group by (|o1-o2| + |o2-o3| + |o3-o1|). The smaller this sum is, the more likely a group is a “group of death”.

The results from this metric are below:

A 42% Brazil, Croatia, Mexico
B 16% Spain, Netherlands, Chile
C 7% Colombia, Japan, Greece
D 0.7% Uruguay, Italy, England
E 7% Switzerland, France, Ecuador
F 27% Argentina, Bosnia, Nigeria
G 23% Germany, Portugal, United States
H 10% Belgium, Russia, South Korea.

From this metric, it is absolutely clear which the most competitive group is – it is group D, with Uruguay, Italy and England. Based on this metric, it is unambiguous that Group D is the group of death. Groups C and E come next according to this measure, followed by Group H.

Zen and the art of shooting

So I was at this resort near Nandi Hills for a day-long workshop on Saturday (actually it was a three-day workshop but my session was only on Saturday so I went there only for one day). One of my colleagues and fellow-teachers had brought along an air gun and at a time when students were busy doing some homework we had given them, we went off for some shooting practice.

First we used cardboard pieces and drew targets on them. I remember taking some four or five rounds at it. First three times I shot way to the right of the target. The following time I decided to correct for this bias and aimed a little left of the target. However, it turned out I had overcompensated and I ended up shooting left.

This was the first time ever in my life that I was shooting (barring toy guns when I was a kid). The first couple of shots I was just getting use to the feel of the gun, the posture, etc. What I found tricky was that there were two viewfinders through which you had to look through simultaneously (genius design – to eliminate parallax error). And then you had to concentrate, focus and shoot.

My first few shots I figured that I thought too much about shooting. I took aim, and then held the position for a while till I was convinced that I was aiming right. Then I would get distracted (damn you, ADHD) and then I would have to try and concentrate again. This would happen a few times until I would go impatient and shoot randomly, and thus miss the target.

After a few rounds of shooting at the cardboard, we moved on to shooting a fruit. Four of us took two cracks each at the fruit, and I was the only one who didn’t manage to hit the fruit at all. On both shots I missed by a long way. I had that sinking feeling I always have when I’m trying to learn something as part of a group and end up being clearly the worst in the group. That’s a frequent feeling for me nowadays.

So for the last round where we used an empty Bacardi carton as our target (the aim was to hit the face of the Bat logo on the carton), I decided to adopt what one of my friends called the “Zen method”. “The first time you take aim, just shoot. Don’t over think”, he said. I had some reputation to salvage.

We all took two shots each at the carton. I did what I was told. As soon as I had taken aim, I shot. I ended up hitting the bat logo once on the tail and once on one of its legs. Here is a photo taken as soon as I had shot the tail (red circle; the other shot on the bat is a colleague’s). The Zen method worked!

shooting


PS: I think this is the first time ever I’ve put up my photo on my blog. So all those of you who read this but don’t follow me on any other social medium – you finally know what I look like.

Is TripAdvisor killing Expedia?

The coming of the internet has led to one round of disintermediation in the travel market, and I hypothesize that review websites such as TripAdvisor are going to lead to another. Let me explain.

In the “good old days” if you wanted to travel there was no option but to reach out to the neighbourhood travel agent who would give you options of a few airlines and hotels. The best you could do to figure out if you were being taken for a ride was to check across multiple agents, but even then the only thing you could compare was price. It was impossible to compare hotels in terms of quality and you would take the word of the travel agent.

And then the internet happened.

Now, with sites such as Expedia or Travelocity, you got more transparency in pricing – especially when it came to airline ticketing. The travel agent could no longer take you for a ride when it came to the air fares – you could cross check online and bypass the agent if he wasn’t offering you a good deal (of course some things such as flexible schedules were best booked via agents, and they continue to hold sway in the corporate segment for that reason). Simultaneously airlines started selling tickets direct, via their own websites (this was led in part by “low cost carriers” who saw this as a good way of saving cost by cutting out agent fees).

This was the  first round of disintermediation in the travel industry. Airlines selling tickets direct and customers being able to book directly online meant the overall business of travel agents reduced. Some of them were cut out completely while others were replaced by large-scale technology enabled agents such as Expedia or Travelocity. Those that survived either have corporate clients (who need flexible schedules and have little time to book online) or have resorted to packages – where they arrange for flights, accommodation and cars, and quote you a consolidated fee – in which there are margins to be made.

The move to large-scale technology-enabled agents meant that some of these agents were now large-scale aggregators. This gave them significant bargaining power vis-a-vis hotels and this allowed them to bargain for deep discounts. While earlier conventional wisdom was that “travel agents” could get you “good deals”, now these large online aggregators were the ones providing the “best deals”. Thus it made eminent sense to book via these aggregators.

Simultaneously most hotels also started direct booking on their own websites. However, the problem was that the hotels themselves did not have the technological capability to implement good revenue management practices on their own websites. They also did not have the technological capability to offer a seamless and smooth booking experience. Thus, large online agents such as booking.com and Agoda prospered.

There are two functions that a travel agent performs – helping customers discover hotels and then actually executing the booking. In the traditional model, agents don’t charge for the discovery process. That service is instead cross-subsidized by the fees they make on the actual booking process. The first level of disintermediation in the travel agency (which we’ve seen above) has chipped away at this model, however. What do I, a travel agent, have to gain if I put in painstaking research and find you a hotel, only for you to find that you can book it for a lower price online? Agents, however, have not figured out a way to charge for the discovery process.

However, it is unlikely that they need to. For you now have websites such as TripAdvisor which have user-generated reviews and ratings for a large number of hotels, and which rank hotels in each city by type and user ratings. TripAdvisor has become so ubiquitous for user-generated ratings for hotels that nowadays travel agents add links to TripAdvisor profiles of hotels that they are recommending. Thus, we can see that the hotel discovery process can exist independently of travel agents.

What of the bookings itself? Don’t we need travel agents for that? Note that irrespective of whether a travel agent is online or offline, the hotel has to pay them a commission for selling their inventory. In the past given their size, hotels (unlike airlines) were unable to effectively sell rooms on their own websites and thus resorted to paying travel agents. However, advances in technology now mean that it is easy for a hotel to adopt a third-party software to effectively manage their inventory and sell tickets on their own website, and at a fraction of the cost they need to pay travel agents.

So, if TripAdvisor helps you discover hotels and then you can book hotels directly through their own websites, who needs travel agents? For now, most large online aggregators have a price matching policy and thus match the prices that hotels quote on their own websites. However, in order to save booking fees (rumoured to be of the order of 17% of the total booking value) hotels are trying to innovate and add freebies to their offering.

For example, a hotel in Cambodia I stayed in last week offered a free massage to guests who had booked through their own website (unfortunately I booked via Agoda and couldn’t avail of this offer). The Bangkok hotel I stayed in last week offered a 10% discount on payments made via American Express on their own website (again we discovered this after we had booked on Agoda, using an AmEx. To their credit, Agoda gave us a refund to the extent of the discount we would have got on the hotel website).

Essentially hotels have figured that with the growing popularity of platforms such as TripAdvisor, they don’t really need travel agents, small or large. As TripAdvisor gets more popular and third party hotel booking softwares gain traction, we are likely to see the decline of large travel aggregators such as Expedia, Travelocity and Agoda.

In essence, the growth of TripAdvisor is going to lead to the partial downfall of its erstwhile parent Expedia.