More on statistics and machine learning

I’m thinking of a client problem right now, and I thought that something that we need to predict can be modelled as a function of a few other things that we will know.

Initially I was thinking about it from the machine learning perspective, and my thought process went “this can be modelled as a function of X, Y and Z. Once this is modelled, then we can use X, Y and Z to predict this going forward”.

And then a minute later I context switched into the statistical way of thinking. And now my thinking went “I think this can be modelled as a function of X, Y and Z. Let me build a quick model to see if the goodness of fit, and whether a signal actually exists”.

Now this might reflect my own biases, and my own processes for learning to do statistics and machine learning, but one important difference I find is that in statistics you are concerned about the goodness of fit, and whether there is a “signal” at all.

While in machine learning as well we look at what the predictive ability is (area under ROC curve and all that), there is a bit of delay in the process between the time we model and the time we look for the goodness of fit. What this means is that sometimes we can get a bit too certain about the models that we want to build without thinking if in the first place they make sense and there’s a signal in that.

For example, in the machine learning world, the concept of R Square is not defined for regression –  the only thing that matters is how well you can predict out of sample. So while you’re building the regression (machine learning) model, you don’t have immediate feedback on what to include and what to exclude and whether there is a signal.

I must remind you that machine learning methods are typically used when we are dealing with really high dimensional data, and where the signal usually exists in the interplay between explanatory variables rather than in a single explanatory variable. Statistics, on the other hand, is used more for low dimensional problems where each variable has reasonable predictive power by itself.

It is possibly a quirk of how the two disciplines are practiced that statistics people are inherently more sceptical about the existence of signal, and machine learning guys are more certain that their model makes sense.

What do you think?

Good vodka and bad chicken

When I studied Artificial Intelligence, back in 2002, neural networks weren’t a thing. The limited compute capacity and storage available at that point in time meant that most artificial intelligence consisted of what is called “rule based methods”.

And as part of the course we learnt about machine translation, and the difficulty of getting the implicit meaning across. The favourite example by computer scientists in that time was the story of how some scientists translated “the spirit is willing but the flesh is weak” into Russian using an English-Russian translation software, and then converted it back into English using a Russian-English translation software.

The result was “the vodka is excellent but the chicken is not good”.

While this joke may not be valid any more thanks to the advances in machine translation, aided by big data and neural networks, the issue of translation is useful in other contexts.

Firstly, speaking in a language that is not your “technical first language” makes you eschew jargon. If you have been struggling to get rid of jargon from your professional vocabulary, one way to get around it is to speak more in your native language (which, if you’re Indian, is unlikely to be your technical first language). Devoid of the idioms and acronyms that you normally fill your official conversation with, you are forced to think, and this practice of talking technical stuff in a non-usual language will help you cut your jargon.

There is another use case for using non-standard languages – dealing with extremely verbose prose. A number of commentators, a large number of whom are rather well-reputed, have this habit of filling their columns with flowery language, GRE words, repetition and rhetoric. While there is usually some useful content in these columns, it gets lost in the language and idioms and other things that would make the columnist’s high school English teacher happy.

I suggest that these columns be given the spirit-flesh treatment. Translate them into a non-English language, get rid of redundancies in sentences and then  translate them back into English. This process, if the translators are good at producing simple language, will remove the bluster and make the column much more readable.

Speaking in a non-standard language can also make you get out of your comfort zone and think harder. Earlier this week, I spent two hours recording a podcast in Hindi on cricket analytics. My Hindi is so bad that I usually think in Kannada or English and then translate the sentence “live” in my head. And as you can hear, I sometimes struggle for words. Anyway here is the thing. Listen to this if you can bear to hear my Hindi for over an hour.

Ticking all the boxes

Last month my Kindle gave up. It refused to take charge, only heating up the  charging cable (and possibly destroying an Android charger) in the process. This wasn’t the first time this was happening.

In 2012, my first Kindle had given up a few months after I started using it, with its home button refusing to work. Amazon had sent me a new one then (I’d been amazed at the no-questions-asked customer-centric replacement process). My second Kindle (the replacement) developed problems in 2016, which I made worse by trying to pry it open with a knife. After I had sufficiently damaged it, there was no way I could ask Amazon to do anything about it.

Over the last year, I’ve discovered that I read much faster on my Kindle than in print – possibly because it allows me to read in the dark, it’s easy to hold, I can read without distractions (unlike phone/iPad) and it’s easy on the eye. I possibly take half the time to read on a Kindle what I take to read in print. Moreover, I find the note-taking and highlighting feature invaluable (I never made a habit of taking notes on physical books).

So when the kindle stopped working I started wondering if I might have to go back to print books (there was no way I would invest in a new Kindle). Customer care confirmed that my Kindle was out of warranty, and after putting me on hold for a long time, gave me two options. I could either take a voucher that would give me 15% off on a new Kindle, or the customer care executive could “talk to the software engineers” to see if they could send me a replacement (but there was no guarantee).

Since I had no plans of buying a new Kindle, I decided to take a chance. The customer care executive told me he would get back to me “within 24 hours”. It took barely an hour for him to call me back, and a replacement was in my hands in 2 days.

It got me wondering what “software engineers” had to do with the decision to give me a replacement (refurbished) Kindle. Shortly I realised that Amazon possibly has an algorithm to determine whether to give a replacement Kindle for those that have gone kaput out of warranty. I started  trying to guess what such an algorithm might look like.

The interesting thing is that among all the factors that I could list out based on which Amazon might make a decision to send me a new Kindle, there was not one that would suggest that I shouldn’t be given a replacement. In no particular order:

  • I have been an Amazon Prime customer for three years now
  • I buy a lot of books on the Kindle store. I suspect I’ve purchased books worth more than the cost of the Kindle in the last year.
  • I read heavily on the Kindle
  • I don’t read Kindle books on other apps (phone / iPad / computer)
  • I haven’t bought too many print books from Amazon. Most of the print books I’ve bought have been gifts (I’ve got them wrapped)
  • My Goodreads activity suggests that I don’t read much outside of what I’ve bought from the Kindle store

In hindsight, I guess I made the correct decision of letting the “software engineers” determine whether I qualify for a new Kindle. I guess Amazon figured that had they not sent me a new Kindle, there was a significant amount of low-marginal-cost sales that they were going to lose!

I duly rewarded them with two book purchases on the Kindle store in the course of the following week!

Human, Animal and Machine Intelligence

Earlier this week I started watching this series on Netflix called “Terrorism Close Calls“. Each episode is about an instance of attempted terrorism that has been foiled in the last 2 decades. For example, there is one example of the plot to bomb a set of transatlantic flights from London to North America in 2006 (a consequence of which is that liquids still aren’t allowed on board flights).

So the first episode of the series involves this Afghani guy who drives all the way from Colorado to New York to place a series of bombs in the latter’s subways (metro train system). He is under surveillance through the length of his journey, and just as he is about to enter New York, he is stopped for what seems like a “routine drugs test”.

As the episode explains, “a set of dogs went around his car sniffing”, but “rather than being trained to sniff drugs” (as is routine in such a stop), “these dogs had been trained to sniff explosives”.

This little snippet got me thinking about how machines are “trained” to “learn”. At the most basic level, machine learning involves showing a large number of “positive cases” and “negative cases” based on which the program “learns” the differences between the positive and negative cases, and thus to identify the positive cases.

So if you want to built a system to identify cats in an image, you feed the machine a large number of images with cats in them, and a large(r) number of images without cats in them, each appropriately “labelled” (“cat” or “no cat”) and based on the differences, the system learns to identify cats.

Similarly, if you want to teach a system to detect cancers based on MRIs, you show it a set of MRIs that show malignant tumours, and another set of MRIs without malignant tumours, and sure enough the machine learns to distinguish between the two sets (you might have come across claims of “AI can cure cancer”. This is how it does it).

However, AI can sometimes go wrong by learning the wrong things. For example, an algorithm trained to recognise sheep started classifying grass as “sheep” (since most of the positive training samples had sheep in meadows). Another system went crazy in its labelling when an unexpected object (an elephant in a drawing room) was present in the picture.

While machines learn through lots of positive and negative examples, that is not how humans learn, as I’ve been observing as my daughter grows up. When she was very little, we got her a book with one photo each of 100 different animals. And we would sit with her every day pointing at each picture and telling her what each was.

Soon enough, she could recognise cats and dogs and elephants and tigers. All by means of being “trained on” one image of each such animal. Soon enough, she could recognise hitherto unseen pictures of cats and dogs (and elephants and tigers). And then recognise dogs (as dogs) as they passed her on the street. What absolutely astounded me was that she managed to correctly recognise a cartoon cat, when all she had seen thus far were “real cats”.

So where do animals stand, in this spectrum of human to machine learning? Do they recognise from positive examples only (like humans do)? Or do they learn from a combination of positive and negative examples (like machines)? One thing that limits the positive-only learning for animals is the limited range of their communication.

What drives my curiosity is that they get trained for specific things – that you have dogs to identify drugs and dogs to identify explosives. You don’t usually have dogs that can recognise both (specialisation is for insects, as they say – or maybe it’s for all non-human animals).

My suspicion (having never had a pet) is that the way animals learn is closer to how humans learn – based on a large number of positive examples, rather than as the difference between positive and negative examples. Just that the limit of the animal’s communication being limited means that it is hard to train them for more than one thing (or maybe there’s something to do with their mental bandwidth as well. I don’t know).

What do you think? Interestingly enough, there is a recent paper that talks about how many machine learning systems have “animal-like abilities” rather than coming close to human intelligence.

For millions of years, mankind lived, just like the animals.
And then something happened that unleashed the power of our imagination. We learned to talk
– Stephen Hawking, in the opening of a Roger Waters-less Pink Floyd’s Keep Talking

I’m not a data scientist

After a little over four years of trying to ride a buzzword wave, I hereby formally cease to call myself a data scientist. There are some ongoing assignments where that term is used to refer to me, and that usage will continue, but going forward I’m not marketing myself as a “data scientist”, and will not use the phrase “data science” to describe my work.

The basic problem is that over time the term has come to mean something rather specific, and that doesn’t represent me and what I do at all. So why did I go through this long journey of calling myself a “data scientist”, trying to fit in in the “data science community” and now exiting?

It all started with a need to easily describe what I do.

To recall, my last proper full-time job was as a Quant at a leading investment bank, when I got this idea that rather than building obscure models for trading obscure corner cases, I might as well use use my model-building skills to solve “real problems” in other industries which were back then not as well served by quants.

So I started calling myself a “Quant consultant”, except that nobody really knew what “quant” meant. I got variously described as a “technologist” and a “statistician” and “data monkey” and what not, none of which really captured what I was actually doing – using data and building models to help companies improve their businesses.

And then “data science” happened. I forget where I first came across this term, but I had been primed for it by reading Hal Varian saying that the “sexiest job in the next ten years will be statisticians”. I must mention that I had never come across the original post by DJ Patil and Thomas Davenport (that introduces the term) until I looked for it for my newsletter last year.

All I saw was “data” and “science”. I used data in my work, and I tried to bring science into the way my clients thought. And by 2014, Data Science had started becoming a thing. And I decided to ride the wave.

Now, data science has always been what artificial intelligence pioneer Marvin Minsky called a “suitcase term” – words or phrases that mean different things to different people (I heard about the concept first from this brilliant article on the “seven deadly sins of AI predictions“).

For some people, as long as some data is involved, and you do something remotely scientific it is data science. For others, it is about the use of sophisticated methods on data in order to extract insights. Some others conflate data science with statistics. For some others, only “machine learning” (another suitcase term!) is data science. And in the job market, “data scientist” can sometimes be interpreted as “glorified Python programmer”.

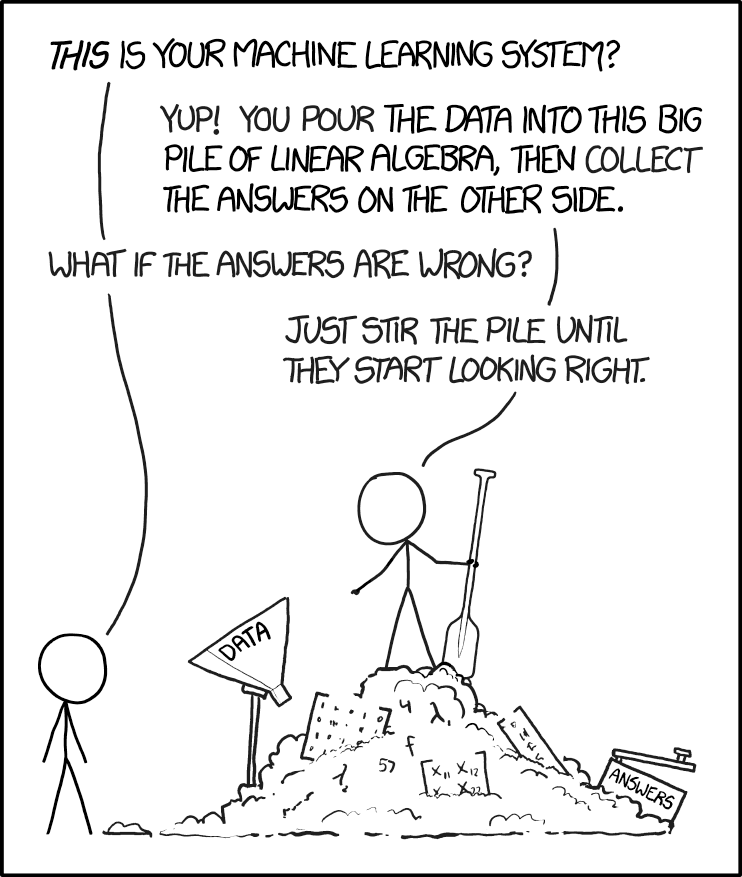
And right from inception, there were the data science jokes, like this one:

It is pertinent to put a whole list of it here.

‘Data Scientist’ is a Data Analyst who lives in California”
“A data scientist is someone who is better at statistics than any software engineer and better at software engineering than any statistician.”
“A data scientist is a business analyst who lives in New York.”
“A data scientist is a statistician who lives in San Francisco.”
“Data Science is statistics on a Mac.”

I loved these jokes, and thought I had found this term that had rather accurately described me. Except that it didn’t.

The thing with suitcase terms is that they evolve over time, as they start getting used differentially in different contexts. And so it was with data science. Over time, it has been used in a dominant fashion by people who mean it in the “machine learning” sense of the term. In fact, in most circles, the defining features of data scientists is the ability to write code in python, and to use the scikit learn package – neither of which is my distinguishing feature.

While this dissociation with the phrase “data science” has been coming for a long time (especially after my disastrous experience in the London job market in 2017), the final triggers I guess were a series of posts I wrote on LinkedIn in August/September this year.

The good thing about writing is that it helps you clarify your mind, and as I ranted about what I think data science should be, I realised over time that what I have in mind as “data science” is very different from what the broad market has in mind as “data science”. As per the market definition, just doing science with data isn’t data science any more – instead it is defined rather narrowly as a part of the software engineering stack where problems are solved based on building machine learning models that take data as input.

So it is prudent that I stop using the phrase “data science” and “data scientist” to describe myself and the work that I do.

PS: My newsletter will continue to be called “the art of data science”. The name gets “grandfathered” along with other ongoing assignments where I use the term “data science”.

Statistics and machine learning approaches

A couple of years back, I was part of a team that delivered a workshop in machine learning. Given my background, I had been asked to do a half-day session on Regression, and was told that the standard software package being used was the scikit-learn package in python.

Both the programming language and the package were new to me, so I dug around a few days before the workshop, trying to figure out regression. Despite my best efforts, I couldn’t locate how to find out the R^2. What some googling told me was surprising:

There exists no R type regression summary report in sklearn. The main reason is that sklearn is used for predictive modelling / machine learning and the evaluation criteria are based on performance on previously unseen data

As it happened, I requested the students at the workshop to install a package called statsmodels, which provides standard regression outputs. And then I proceeded to lecture to them on regression as I know it, including significance scores, p values, t statistics, multicollinearity and the likes. It was only much later was I to figure out that that is now how regression (and logistic regression) is done in the machine learning world.

In a statistical framework, the data sets in regression are typically “long” – you have a large number of data points, and a small number of variables. Putting it differently, we start off with a model with few degrees of freedom, and then “constrain” the variables with a large enough number of data points, so that if a signal exists, and it is in the right format (linear relationship and all that), we can pin it down effectively.

In a machine learning framework, it is common to run a regression where the number of data points is of the same order of magnitude as, or even smaller than the number of variables. Strictly speaking, such a problem is unbounded (there are too many degrees of freedom), and so regression is not well-defined. Instead, we rely upon “regularisation methods” to “tie down” the variables and (hopefully) produce a consistent solution.

Moreover, machine learning approaches are common to problems where individual predictor variables don’t have meaning. In this scenario, knowing whether a particular variable is significant or not is of no utility. Then, the signal in machine learning lies in the combination of variables, which means that multicollinearity (correlation between predictor variables) is not really a bad thing as it is in statistics. Variables not having meanings means that there are no correlations per se to be defined, and so machine learning models are harder to interpret, and are more likely to have hidden spurious correlations.

Also, when you have a small number of variables and a large number of data points, it is easy to get an “exact solution” for regression, which is what statistical methods use. In a machine learning framework with “wide” data, though, exact solutions are computationally infeasible, and so you need to use approximate algorithms such as gradient descent – which are common across ML techniques.

All in all, while statistics and machine learning might use techniques with the same name (“regression”, for example), they are both in theory and practice, very different ways to solve the problem. The important thing is to figure out the approach most suited for a particular problem, and use it accordingly.

Meaningful and meaningless variables (and correlations)

A number of data scientists I know like to go about their business in a domain-free manner. They make a conscious choice to not know anything about the domain in which they are solving the problem, and instead treat a dataset as just a set of anonymised data, and attack it with the usual methods.

I used to be like this as well a long time ago. I remember in my very first job I had pissed off some clients by claiming that “I don’t care if this is a nut or a screw. As far as I’m concerned this is just a part number”.

Over time, though, I’ve come to realise that even a little bit of domain knowledge or intuition can help build significantly superior models. To use a framework I had introduced a few months back, your domain knowledge can be used to restrict the degrees of freedom in your model, thus increasing how much the machine can learn with the available data.

Then again, some problems lend themselves better to domain-based intuition than others, and this has to do with the meaning of a data point.

Consider two fairly popular problem statements from data science – determining whether a borrower will pay back a loan, and determining whether there is a cat in a given picture. While at the surface level, both are binary decisions, to be made by looking at large dimensional data (the number of data points that can be used for credit scoring can be immense), there is an important distinction between the two problems.

In the cat picture case, a single data point is basically the colour of a single pixel in an image, and it doesn’t really mean anything. If we were to try and build a cat recognition algorithm based on a single pre-chosen pixel in an image, it is unlikely we can do better than noise. Instead, the information is encoded in groups of pixels near each other – a bunch of pixels that look like cat ears, for example. In this case, whether you are training to model to identify cats or cinnamon buns is immaterial, and the domain-free approach works well.

With the credit scoring problem, the amount of information in each explanatory variable is significant. Unless we are looking at some extremely esoteric or insignificant variables (trust me, these get used fairly often in credit scoring models), it is possible to build a decision model based on just one explanatory variable and still have significant predictive power. There is definitely information in correlation between explanatory variables, but that pales compared to the information in the variables themselves.

And the amount of information captured by each explanatory variable means that it makes sense in these cases to invest some human effort to understand the variables and the impact it is having. In some cases, you might decide to use a mathematical transformation of a variable (square or log or inverse) instead of the variable itself. In other cases, you might determine based on logic that some correlations are spurious and drop the variables altogether. You might see a few explanatory variables with largely similar information and decide to drop some of them or use dimension reduction algorithms. And you can do a much better job of this if you have some experience or intuition about the domain, and care to understand what each variable means. Because variables have meanings.

Unlike in the image recognition problem, where most of the intuition is in the correlation term, because of which the “variables” don’t have any meaning, where domain doesn’t matter that much (though it can – in that some kinds of algorithms are superior at some kinds of images. I don’t have much experience in this domain to comment 🙂 ).

Again like in all the two-by-twos that I produce (and there are many, though this is arguably the most famous one), the problem is where you take people from one side and put them in a situation from the other side.

If you come from a background where you’ve mostly dealt with datasets where each individual variable is meaningless, but there is information in the collective, you are likely to “stir the pile” rather than using intuition to build better models.

If you are used to dealing with datasets with “meaning”, where variables hold the information, you might waste time doing your jiggery-pokery when you should be looking to apply models that get information in the collective.

The problem is this is a rather esoteric classification, so there is plenty of chance for people to be thrown into the wrong end.

Statistics and machine learning

So a group of statisticians (from Cyprus and Greece) have written an easy-to-read paper comparing statistical and machine learning methods in time series forecasting, and found that statistical methods do better, both in terms of accuracy and computational complexity.

To me, there’s no surprise in the conclusion, since in the statistical methods, there is some human intelligence involved, in terms of removing seasonality, making the time series stationary and then using statistical methods that have been built specifically for time series forecasting (including some incredibly simple stuff like exponential smoothing).

Machine learning methods, on the other hand, are more general purpose – the same neural networks used for forecasting these time series, with changed parameters, can be used for predicting something else.

In a way, using machine learning for time series forecasting is like using that little screwdriver from a Swiss army knife, rather than a proper screwdriver. Yes, it might do the job, but it’s in general inefficient and not an effective use of resources.

Yet, it is important that this paper has been written since the trend in industry nowadays has been that given cheap computing power, machine learning be used for pretty much any problem, irrespective of whether it is the most appropriate method for doing so. You also see the rise of “machine learning purists” who insist that no human intelligence should “contaminate” these models, and machines should do everything.

By pointing out that statistical techniques are superior at time series forecasting compared to general machine learning techniques, the authors bring to attention that using purpose-built techniques can actually do much better, and that we can build better systems by using a combination of human and machine intelligence.

They also helpfully include this nice picture that summarises what machine learning is good for, and I wholeheartedly agree: 

The paper also has some other gems. A few samples here:

Knowing that a certain sophisticated method is not as accurate as a much simpler one is upsetting from a scientific point of view as the former requires a great deal of academic expertise and ample computer time to be applied.


[…] the post-sample predictions of simple statistical methods were found to be at least as accurate as the sophisticated ones. This finding was furiously objected to by theoretical statisticians [76], who claimed that a simple method being a special case of e.g. ARIMA models, could not be more accurate than the ARIMA one, refusing to accept the empirical evidence proving the opposite.


A problem with the academic ML forecasting literature is that the majority of published studies provide forecasts and claim satisfactory accuracies without comparing them with simple statistical methods or even naive benchmarks. Doing so raises expectations that ML methods provide accurate predictions, but without any empirical proof that this is the case.


At present, the issue of uncertainty has not been included in the research agenda of the ML field, leaving a huge vacuum that must be filled as estimating the uncertainty in future predictions is as important as the forecasts themselves.

Beer and diapers: Netflix edition

When we started using Netflix last May, we created three personas for the three of us in the family – “Karthik”, “Priyanka” and “Berry”. At that time we didn’t realise that there was already a pre-created “kids” (subsequently renamed “children” – don’t know why that happened) persona there.

So while Priyanka and I mostly use our respective personas to consume Netflix (our interests in terms of video content hardly intersect), Berry uses both her profile and the kids profile for her stuff (of course, she’s too young to put it on herself. We do it for her). So over the year, the “Berry” profile has been mostly used to play Peppa Pig, and the occasional wildlife documentary.

Which is why we were shocked the other day to find that “Real life wife swap” had been recommended on her account. Yes, you read that right. We muttered a word of abuse about Netflix’s machine learning algorithms and since then have only used the “kids” profile to play Berry’s stuff.

Since then I’ve been wondering what made Netflix recommend “real life wife swap” to Berry. Surely, it would have been clear to Netflix that while it wasn’t officially classified as one, the Berry persona was a kid’s account? And even if it didn’t, didn’t the fact that the account was used for watching kids’ stuff lead the collaborative filtering algorithms at Netflix to recommend more kids’ stuff? I’ve come up with various hypotheses.

Since I’m not Netflix, and I don’t have their data, I can’t test it, but my favourite hypothesis so far involves what is possibly the most commonly cited example in retail analytics – “beer and diapers“. In this most-likely-apocryphal story, a supermarket chain discovered that beer and diapers were highly likely to appear together in shopping baskets. Correlation led to causation and a hypothesis was made that this was the result of tired fathers buying beer on their diaper shopping trips.

So the Netflix version of beer-and-diapers, which is my hypothesis, goes like this. Harrowed parents are pestered by their kids to play Peppa Pig and other kiddie stuff. The parents are so stressed that they don’t switch to the kid’s persona, and instead play Peppa Pig or whatever from their own accounts. The kid is happy and soon goes to bed. And then the parent decides to unwind by watching some raunchy stuff like “real life wife swap”.

Repeat this story in enough families, and you have a strong enough pattern that accounts not explicitly classified as “kids/children” have strong activity of both kiddie stuff and adult content. And when you use an account not explicitly mentioned as “kids” to watch kiddie stuff, it gets matched to these accounts that have created the pattern – Netflix effectively assumes that watching kid stuff on an adult account indicates that the same account is used to watch adult content as well. And so serves it to Berry!

Machine learning algorithms basically work on identifying patterns in data, and then fitting these patterns on hitherto unseen data. Sometimes the patterns make sense – like Google Photos identifying you even in your kiddie pics. Other times, the patterns are offensive – like the time Google Photos classified a black woman as a “gorilla“.

Thus what is necessary is some level of human oversight, to make sure that the patterns the machine has identified makes some sort of sense (machine learning purists say this is against the spirit of machine learning, since one of the purposes of machine learning is to discover patterns not perceptible to humans).

That kind of oversight at Netflix would have suggested that you can’t tag a profile to a “kiddie content AND adult content” category if the profile has been used to watch ONLY kiddie content (or ONLY adult content). And that kind of oversight would have also led Netflix to investigate issues of users using “general” account for their kids, and coming up with an algorithm to classify such accounts as kids’ accounts, and serve only kids’ content there.

It seems, though, that algorithms run supreme at Netflix, and so my baby daughter gets served “real life wife swap”. Again, this is all a hypothesis (real life wife swap being recommended is a fact, of course)!

Stirring the pile efficiently

Warning: This is a technical post, and involves some code, etc. 

As I’ve ranted a fair bit on this blog over the last year, a lot of “machine learning” in the industry can be described as “stirring the pile”. Regular readers of this blog will be familiar with this image from XKCD by now:

Source: https://xkcd.com/1838/

Basically people simply take datasets and apply all the machine learning techniques they have heard of (implementation is damn easy – scikit learn allows you to implement just about any model in three similar looking lines of code; See my code here to see how similar the implementation is).

So I thought I’ll help these pile-stirrers by giving some hints of what method to use for different kinds of data. I’ve over-simplified stuff, and so assume that:

  1. There are two predictor variables X and Y. The predicted variable “Z” is binary.
  2. X and Y are each drawn from a standard normal distribution.
  3. The predicted variable Z is “clean” – there is a region in the X-Y plane where Z is always “true” and another region where Z is always “false”
  4. So the idea is to see which machine learning techniques are good at identifying which kind of geometrical figures.
  5. Everything is done “in-sample”. Given the nature of the data, it doesn’t matter if we do it in-sample or out-of-sample.

For those that understand Python (and every pile-stirrer worth his salt is excellent at Python), I’ve put my code in a nice Jupyter Notebook, which can be found here.

So this is what the output looks like. The top row shows the “true values” of Z. Then we have a row for each of the techniques we’ve used, which shows how well these techniques can identify the pattern given in the top row (click on the image for full size).

As you can see, I’ve chosen some common geometrical shapes and seen which methods are good at identifying those. A few pertinent observations:

  1. Logistic regression and linear SVM are broadly similar, and both are shit for this kind of dataset. Being linear models, they fail to deal with non-linear patterns
  2. SVM with RBF kernel is better, but it fails when there are multiple “true regions” in the dataset. At least it’s good at figuring out some non-linear patterns. However, it can’t figure out the triangle or square – it draws curves around them, instead.
  3. Naive Bayesian (I’ve never understood this even though I’m pretty good at Bayesian statistics, but I understand this is a commonly used technique; and I’ve used default parameters so not sure how it is “Bayesian” even) can identify some stuff but does badly when there are disjoint regions where Z is true.
  4. Ensemble methods such as Random Forests and Gradient Boosting do rather well on all the given inputs. They do well for both polygons and curves. Elsewhere, Ada Boost mostly does well but trips up on the hyperbola.
  5. For some reason, Lasso fails to give an output (in the true spirit of pile-stirring, I didn’t explore why). Ridge is again a regression method and so does badly on this non-linear dataset
  6. Neural Networks (Multi Layer Perceptron to be precise) does reasonably well, but can’t figure out the sharp edges of the polygons.
  7. Decision trees again do rather well. I’m pleasantly surprised that they pick up and classify the disjoint sets (multi-circle and hyperbola) correctly. Maybe it’s the way scikit learn implements them?

Of course, the datasets that one comes across in real life are never such simple geometrical figures, but I hope that this set can give you some idea on what techniques to use where.

At least I hope that this makes you think about the suitability of different techniques for the data rather than simply applying all the techniques you know and then picking the one that performs best on your given training and test data.

That would count as nothing different from p-hacking, and there’s an XKCD for that as well!

Source: https://xkcd.com/882/