News and the Cornish coastline

Following news at more frequent intervals means there is more negative news, and thus a greater chance of getting triggered. 

How much news exists in the world? Is there enough news to fit a daily newspaper? Is there enough news to fit a daily that is focussed on a city? Is there enough news for All India Radio to cover in its three (?) news broadcasts a day? And what about 24/7 news channels? Do they have enough news?

The answer to this question is simple – within reasonable limits, irrespective of how frequently you want to report the news, there will be in some way or the other sufficient news to report.

In some ways, this is like that famous question in Chaos Theory about the length of the Cornish coast. The answer is – it depends upon the ruler.

The length of the famously jagged Cornish coast depends upon the length of the ruler you use to measure it. The smaller the length of the ruler that you use, the more the indentations in the coastline matter, and thus the longer the coast. There is a limit there, of course, if I remember, the “fractal dimension” of the Cornish coast is 1.33 or something.

It is similar with news. The amount of news that is there to report is a function of how frequently you want to report it. A good analogy here is with the stock markets.

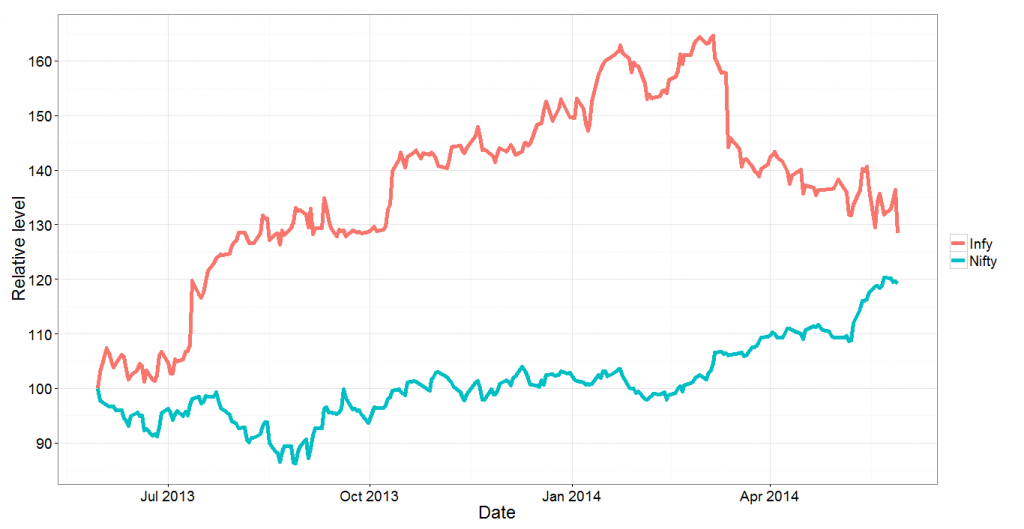
As regular readers of this blog might well know, stock price movement, upto some approximation, follow a random walk. This means that the “distance” covered by the stock ticker during the day is far higher than the “displacement”.

So a stock might gain 10% in the first minute of trading, and then lose 5% in the next hour, and then lose all its gains by lunchtime, and then go up and down and round and round and then end up pretty much where it started off at the beginning of the day.

If you are now reporting the news of this stock market with a “one day ruler” (say for your business daily), the market did nothing that day. However, if you have been watching its movement on CNBC (or any other real time news channel), there was a lot to report.

All news is this way. When you follow it at frequent intervals (through 24/7 TV, or through Twitter, for example), there appears to be a lot more news than there actually is when you follow it using a daily newspaper. And given that any piece of negative news is likely to cause anxiety, following news at more frequent intervals exposes you to far more negative news (think the stock market example again), and thus causes far more anxiety.

Not following the news at all (as I did for a while when I was in undergrad) sometimes means that you’ve missed out on all that has happened in the world, and might find it hard to cope with life. And so there is a tradeoff. This involves using a (time) ruler of an appropriate length.

Use too short a ruler and you cause yourself unnecessary anxiety and find yourself getting triggered all the time. Use too long a ruler and you find that you miss out on stuff that might have been necessary for you to know.

The frequency I’ve settled down upon is daily. I get three newspapers delivered to my door each morning, and that is how I’m informed about the world.

It’s interesting that back when the New York Times was a dead-tree periodical, it had a tagline that went “all the news that’s fit to print”. Now that it’s gone online, got a paywall and had to get into real time news, it’s become an outrage machine.


The NRN premium is over

With the resignation of Infosys President BG Srinivas and the subsequent drop in the share price in the markets today, the NR Narayana Murthy premium on the Infosys stock is over. Ironically, this happens almost exactly a year since NRN made a comeback to the company in an executive capacity.

The figure below charts how the Infosys stock and the market index (Nifty ) have moved in the last one year. In order to compare the two, we have indexed their prices as of 30th May 2013, just before NRN’s return was announced (the announcement was made as of 2nd June, but the sharp spike in Infy on 31st May 2013, when the broad market fell, can be attributed to insider trading by people in the know), to 100. Notice how the Infosys stock soared in the six months after NRN’s return. In January and February, the stock traded at a 60% premium to its pre-NRN value, while the nifty was practically flat till then.

infy1

And then things started dropping. Even when the broad markets rose in March-April this year, Infosys continued to fall. The rally in early-mid May took it along, but now the stock has fallen again. This morning (latest data as of noon), the stock has fallen by about 6% thanks to Srinivas’s departure, and we can see that the gap between Infy and the market has really narrowed.

Next, we look at the ratio of the Infy price to the market index. Again we index it to 100 as of 30th May 2013. This graph shows the premium in the Infy share price over the last year. Notice that for the first time, the premium has fallen below 10% (it’s currently 7%). 

infy2


Finally, we will compare the Infy stock to the CNX IT index, which tracks the sector (that way, any sectoral premium in Infy can be extracted out). Again, we will plot the relative values of Infy to the CNX IT index, indexed to 100 as of 30th May 2013.

infy3

This graph looks like no other. What this tells us is that whatever premium Infosys enjoys over the broad market is a function of the sector, and that ever since the sharp drop in early March (on account of weak results), the NRN premium on the Infy stock relative to the sector has disappeared. As of now, compared to the sector, Infy is at an all time low.

Finally, a regression. If we regress infy stock returns against the returns in the IT index and Nifty, what we find is that Nifty returns hardly affect Infosys returns (R^2 of 7%), while the IT Index returns explain about 76% of Nifty returns. When regressed against both, Nifty returns come out as insignificant and the R^2 remains at 76%.

Putting all these statistics aside, however, the message is simple – the NRN premium on the Infy stock is over.


Investing

I made some money in the markets last week. I bought the Nifty (September futures) at around 5190 on the 28th of August and cashed out at 5660 on the 6th of September. A fair trade I think, considering that so far in my life I’ve been a fairly poor investor (despite having worked as a quant at an investment bank and a hedge fund). This trade, however, raised more questions than answers.

Firstly, the markets have gone up significantly after I sold out. I exited at 5660. The Nifty closed today at well over 5900. Last couple of days I’ve been wondering if I panicked and cashed out too early. I must admit that when I entered I had a target price of 6000. However, given the rather choppy nature of the Indian markets, I decided that the 10% appreciation in 10 days was enough and cashed out. To that extent, I didn’t stay honest to the strategy I entered the trade in.

However, the reason I decided to cash out when I did was that I thought the market was going to top out and a steep fall was imminent. From that perspective, it made sense to cash out when I did. Yes, I might have made more money had I hung on for another two trading days, but there was no guarantee that the markets would continue to rise. In that sense I was happy pulling out.

More importantly when I cashed out, I realized that I’m still an amateur at investing. When you are a professional investor, you look at investment vehicles in terms of opportunity cost. If you wanted to pull out of the Nifty, you would do so only if you could put your money in another investment which would give you superior returns to what the Nifty would in the subsequent time period (technically hard currency is also an investment!), after accounting for the transaction cost of switching. As far as I was concerned here, though, I still invest basically for kicks (don’t invest huge amounts). So it’s basically about spotting a potential boom, riding it and then moving out. Light touch investing.

There are times when I want to get back to the world of investment (as a professional). I have some unique ideas for fund management. Perhaps I should use my next break in billable work to flesh that out. For now, check out my only other post on investing – on why you should not track your portfolio too closely. 

Rupee and dollar volatility of Nifty

Note: This is not a particularly policy related post; just an interesting chart I want to present here.

Out at capitalmind, Deepak Shenoy writes that measured in US Dollars, the NSE Nifty has actually lost 8% in the last 6 years, a period in which the rupee value of the Nifty has gone up by 36%. This is on account of the depreciation of the Indian Rupee against the US Dollar.

Now, it would be interesting to see the volatility of the index as measured in the two currencies. Does the volatility in the USD/INR exchange rate add to the volatility of the Nifty or does it subtract from it? (note that when you multiply two volatile indices, the resultant can be less volatile than either of the components, if the components move in opposite directions).

As you can see from the following graph, the two volatilities actually add up, meaning the dollar volatility of the Nifty has for most part been much higher than the rupee volatility! And to add that the dollar returns have also been lower than the rupee returns. Makes you wonder why FIIs are still invested in India.

Data source: Oanda and Yahoo Finance

(please disregard the absolute values on the graph. In order to make the graph, I index both nifty and the dollar value of nifty to 100 on the first day of the time series I had and appropriately scaled down both series. The point to notice here is that in most parts the red line (dollar volatility) is above the blue line (rupee volatility). As earlier, I use 30-day quadratic variation as a measure of volatility )


Bloomberg Watching

Two weeks back we were all given dual screens at office. A couple of days after that, those of us that had joined recently got Bloomberg logins. It’s a very restricted version of Bloomberg, with most of the strong features having been disabled. One feature that is enabled, though, is to get the graph of the daily price movement of a security, or an index.

It is necessary to have hobbies at work. It is humanly impossible to concentrate solely on the work for all the eight or ten hours that you spend at office. You need distractions. However, in order to prevent yourself from being too distracted, it helps having one or two very strong distractions. Distractions which can crowd out all other distractions. They can be called “office hobbies”.

In the past, my office hobbies haven’t really been constructive. In my first job, I was part of a PJ Club, and we would exchange horrible jokes. By the time I got to my next job, I had been addicted to Orkut, and kept refreshing it to check if I’d gotten any new scraps. Of course, when there is a cricket match on, the Cricinfo screen makes for a good office hobby. In the last ten days, the World Chess Championship has served my evenings well. However, it is important to have a sustainable hobby which could also be constructive. One which might have a small chance of making impact on your work. And most importantly, it would be ideal if the boss doesn’t really disapprove of your office hobby.

For the last week and half at work, my right screen (remember that I have two screens) has been reserved for Bloomberg Watching. A Bloomberg window is open there in full size, and I would’ve usually put the daily movement graph of the Nifty there. And it updates real-time. It’s like a video game. I just sit and watch. And get fascinated by the kind of twists and turns that the markets take.

Twenty years back, I would spend my evenings in the courtyard of my grandfather’s house in Jayanagar watching ants move about. I would be fascinated by their random, yet orderly movements. I would spend hours together watching them.

Around the same time, I used to play another game. I used to splash water on the (red-oxide coated) walls of my loo, and watch the different streams of water flow down as i crapped. I would get fascinated by the patterns that the water droplets would form, the paths that they would take, the way they would suddenly change speed when they intersected, and so forth. I would end up squatting there long after I’d been done with my crap.

So what I’m doing now is not exactly new. I just watch a point move. Orderly from left to right. Wildly fluctuating in the up-down direction. I look at the patterns and try to guess which animal they look like, or which country they look like. I get fascinated by the sudden twists and turns that the curve takes, and wonder about the collective wisdom of all market participants who are faciliating such movement. I occasionally scream out to my colleagues saying stuff like “nifty below 2600!” and they respond with a “behenchod…” or some equivalent of it.

As the day wears on, I realized that some animals I had recognized earlier in the day are hardly visible now. They are but specks in the larger graph that is the day. And then I realize that unless there was something truly special, the movement of the day will also soon be lost. It will be available for download from the same Bloomberg terminal but that will be about it. And so forth.

Occasionally I catch some unsuspecting soul on my GTalk list and spout such philosophy. I tell them about how after a while everything becomes insignificant. About how we will always be just small players in the larger system. The smarter among them will add their own philosophy to mine, and sometimes we come up with a new theory. The not so smart among them – they will ask me about my views on the market. And what would be good picks (this has been a regular question I’ve been asked ever since I got back into the finance industry but more about that later). And then they say something like how terrorists are the reason the stock markets are plunging, and how the government should protect investors’ money and stuff.

Some day I hope all of this will be useful. Some day I hope my eye for recognizing animals and countries where none exist will enable me to come up with some earthshaking strategy, which can make millions for my fund. However, now that doesn’t matter. All that matters is the unbridled joy of watching the ticker move up and down. Rise and fall. Take baby steps, and the occasional giant leap. It’s surreal.