EPL: Mid-Season Review

Going into the November international break, Liverpool are eight points ahead at the top of the Premier League. Defending champions Manchester City have slipped to fourth place following their loss to Liverpool. The question most commentators are asking is if Liverpool can hold on to this lead.

We are two-thirds of the way through the first round robin of the premier league. The thing with evaluating league standings midway through the round robin is that it doesn’t account for the fixture list. For example, Liverpool have finished playing the rest of the “big six” (or seven, if you include Leicester), but Manchester City have many games to go among the top teams.

So my practice over the years has been to compare team performance to corresponding fixtures in the previous season, and to look at the points difference. Then, assuming the rest of the season goes just like last year, we can project who is likely to end up where.

Now, relegation and promotion introduces a source of complication, but we can “solve” that by replacing last season’s relegated teams with this season’s promoted teams (18th by Championship winners, 19th by Championship runners-up, and 20th by Championship playoff winners).

It’s not the first time I’m doing this analysis. I’d done it once in 2013-14, and once in 2014-15. You will notice that the graphs look similar as well – that’s how lazy I am.

Anyways, this is the points differential thus far compared to corresponding fixtures of last season. 


Leicester are the most improved team from last season, having scored 8 points more than in corresponding fixtures from last season. Sheffield United, albeit starting from a low base, have done extremely well as well. And last season’s runners-up Liverpool are on a plus 6.

The team that has done worst relative to last season is Tottenham Hotspur, at minus 13. Key players entering the final years of their contract and not signing extensions, and scanty recruitment over the last 2-3 years, haven’t helped. And then there is Manchester City at minus 9!

So assuming the rest of the season’s fixtures go according to last season’s corresponding fixtures, what will the final table look  like at the end of the season?
We see that if Liverpool replicate their results from last season for the rest of the fixtures, they should win the league comfortably.

What is more interesting is the gaps between 1-2, 2-3 and 3-4. Each of the top three positions is likely to be decided “comfortably”, with a fairly congested mid-table.

As mentioned earlier, this kind of analysis is unfair to the promoted teams. It is highly unlikely that Sheffield will get relegated based on the start they’ve had.

We’ll repeat this analysis after a couple of months to see where the league stands!

Prodigy

Sometimes I wonder if being a prodigy is more of a curse than a blessing. The sense of having “achieved something” fairly early in life leads to a lowering of objectives, not being excited by anything, and a sort of satisfaction of having “arrived” that reduces motivation to do anything else in life.

A few prodigies keep up the fight and make a successful career for themselves as adults (eg. Sachin Tendulkar). Most fall by the wayside. And find it struggle to come to terms of having become ordinary. And find being an adult incredibly hard, and then get into all sorts of issues.

Five years ago, the Guardian identified the “best young player from each Premier League club“, and they’ve kept at monitoring the progress. Five years later, the results aren’t encouraging.

Out of our 20 players from the English top flight in that 2014-15 season, only three are playing at Premier League clubs now: Marcus Rashford, Dominic Solanke and Hamza Choudhury.

That may not sound very impressive but some others are at Premier League clubs but on loan in the Championship. Six of the 20 are playing second-tier football (five in England and one, Harley Willard, in Iceland) so nearly half are playing at a very high level. On the other hand, two of the 20 – as far as we are aware – are not playing football any more.

While it is natural for parents to push their kids and get them to “achieve something” at a young age, such achievements in most cases don’t result in any lasting advantage as adults. Instead, children who achieve something get labelled as “prodigies” or “gifted” or “talented” and these labels only seek to increase pressures on them as they grow up, rather than helping them build sustainable careers.

OK I might be ranting so I’ll stop here.

Data, football and astrology

Jonathan Wilson has an amusing article on data and football, and how many data-oriented managers in football have also been incredibly superstitious.

This is in response to BT Sport’s (one of the UK broadcasters of the Premier League) announcement of it’s “Unscripted” promotion where “some of the world’s foremost experts in both sports and artificial intelligence to produce a groundbreaking prophecy of the forthcoming season”.

Wilson writes:

I was reminded also of the 1982 film adaptation of Agatha Christie’s 1939 novel Murder is Easy in which a computer scientist played by Bill Bixby enters the details of the case into a programme he has coded to give the name of the murderer. As it turns out, the programmer knows this is nonsense and is merely trying to gauge the reaction of the heroine, played by Lesley-Anne Down, when her name flashes on the screen.

But this, of course, is not what data-based analysis is for. Its predictive element deals in probability not prophecy. It is not possessed of some oracular genius. (That said, it is an intriguing metaphysical question: what if you had all the data, not just ability and fitness, but every detail of players’ diet, relationships and mental state, the angle of blades of grass on the pitch, an assessment of how the breathing of fans affected air flow in the stadium … would the game’s course then be inevitable?)

This reminded me of my own piece that I wrote last year about how data science “is simply the new astrology“.

Liverpool FC: 2014 vs 2019

Last night I watched the first half of the Champions League semifinal between FC Barcelona and Liverpool FC, going off to bed when the score was 1-0 in favour of Barcelona. I woke up this morning to much dismay to see that Liverpool lost 3-0, but I’d constructed this post in my head when Liverpool was trailing 1-0, and so executing now.

It’s about the difference between the title-challenging Liverpool of 2014 and the title-challenging Liverpool of this season. Luis Suarez, in a brilliant interview with Sid Lowe, had mentioned that the current team is much better than the 2014 team, but last night’s Champions League game suggests that the two teams five years apart are simply two very different teams.

Last night Barcelona went ahead with a goal from Suarez in the 25th minute. It wasn’t an easy goal. There was a cross from the left by Jordi Alba, and Suarez got ahead, and managed to get the precise touch required to put it past Alisson into Liverpool’s goal. Liverpool had dominated the game until then, but with that one little half chance Suarez had converted.

Ten minutes later Sadio Mane got a chance to equalise, from a broadly similar chance. It was another ball above the defence from Mo Salah, but Mane hit it to the sky. And that was representative of Liverpool this season – both Mane and Salah have required lots of chances to score.

In that sense, Liverpool’s defence and midfield this season is far superior to the title-challenging side of 2014, when Suarez led the line. Back then few chances were created, but Suarez and an in-form Daniel Sturridge would take most of them, meaning that even with the midfield creating few chances and the defence leaking lots of goals, Liverpool could mount a challenge.

One could only imagine how this season’s team would have performed with someone of Suarez’s finishing ability leading the line. Salah, Mane and Firmino are no doubt a brilliant front three, but their conversion rate is low. If only one of them had a higher conversion rate, we wouldn’t have been struggling in both the League and the Champions League this season.


This is Anfield


I had a massive fanboy time this morning, as I went on my long-awaited (nearly 14 years) pilgrimage to Anfield, home of the Liverpool Football Club. As I had mentioned in my post last night, this was the explicit purpose of my visit to Liverpool, and I had left home with only three bookings – train to Liverpool, hotel in Liverpool and the Anfield tour.

So after having polished off a “large Full English” (in hindsight, I’m thankful for that) at a local cafe close to my hotel, I took an Uber to Anfield. The driver was also a Liverpool fan and we spent time chatting about last afternoon’s game, when Liverpool played insipidly to draw across Stanley Park with Everton. I was in good time for the tour (that was to start at 11), and spent the time walking along the outside of the Main Stand.

There are benches dedicated to Liverpool’s greatest players of all time, and the floor is tiled with names of members (not all members I think – perhaps those that made contributions to rebuild the Main Stand 3 years ago). I paid my respects at the Hillsborough Memorial and walked back to the Kop end where the entrance to the Stadium Tour is situated.

The tour started on the sixth floor of the newly redeveloped Main Stand (if you’ve wondered why TV broadcasts of Liverpool games suddenly started showing a very high angle, this is the reason). Our guide Terry first took us to the hall where there were photos of “Liverpool’s six great managers”.

The choices were interesting – Shankly, Paisley, Fagan, Dalglish, Houllier and Benitez. As the Elo ratings show, these were all definitely managers who improved Liverpool, sometimes in a significant way (though the last two also let things slip considerably towards the end of their reigns.

I sensed some sort of discomfort in the group. Evidently, a majority were Liverpool fans, but talks about “the purpose of the club being to win trophies” and talking up of the number of trophies won so far brought up the painful reality that we’ve “AJMd” on a league, a europa league and a champions league in the last five years itself, and look on course to AJM the league once again. Nobody really wanted to point out that things aren’t going as well as we would like.

In any case, the tour moved on and our guide Terry was excellent, though sometimes he went back to familiar cliches. Describing the miracle of Istanbul, for example, he made the familiar joke of “Milan had Kaka, and we had Djimi Traore, and yet we managed to win”.

We moved on to a view of the pitch from the highest tier of the main stand, my first impression was that this is a rather “cosy” stadium. Now, the only other stadiums I’ve been to are the behemoths Camp Nou and Wembley, and in comparison to them, Anfield looked rather intimate. That also suggested why the crowd at Anfield is sometimes like “Liverpool’s 12th man”, as a poster outside the away dressing room claimed.

The small stadium means the crowd noise can reverberate easily around the stadium. The Anfield Road End is yet to be redeveloped, and once that happens the stadium will become “taller”, meaning the noise levels might get higher. Looking at the pitch from up the Main Stand gave me another regret – that I haven’t watched a game at Anfield (though I did watch Liverpool play at Wembley). Hopefully sometime in this lifetime I’ll fulfil that!

There were cutouts of various players placed near the dressing rooms. Salah’s was the most popular as everyone lined up to take a selfie with him. Rather than waiting there, I managed selfies with cutouts of all of Firmino, van Dijk and Alisson. The dressing rooms were impressive (especially the Home dressing room). I also found the differences between home and away dressing rooms interesting – the home room is soundproof while the away room isn’t. The home room has lighting control to adjust the lighting to the pitch. The away room has no such facilities. These are subtle differences we don’t appreciate as TV viewers, but can have a profound impact on the game.

And based on this, I don’t mind the draws at Manchester United and Everton that much!


You’ll Never Walk Alone

I first became a fan of Liverpool FC in April 2005, on the day of the first leg of their Champions League semifinal against Chelsea. While I was in London for a month and half after that, I never really executed on the pilgrimage to Anfield. Instead I went on trips around the country which my friends had planned.

For a long time, this was on my To-Do list. Yet, I continued to be lazy. I moved to England exactly two years ago, but had somehow kept putting off my trip to Liverpool. The initial plan had been to do it with family, carrying my daughter as she put her hands on the “this is anfield” signboard.

Finally, as it happens, I’ve made the trip just before we end our current stint in London and move back to India. And unlike that plan of that photo-op of my daughter with her hand on the “this is anfield” sign, I’ve come to Liverpool alone.

I don’t know the last time I had one an “unplanned trip”. This time I did some planning, though, but haven’t booked much. As things stand now, I’ve only booked my train to Liverpool (which I took this evening), my hotel for the night (where I’m writing this from) and the Anfield tour for tomorrow morning.

In my eagerness to get to the hotel after the train rolled in to Liverpool Lime Street at 10:20 PM tonight, I exited the station without bothering to see where the taxi rank was. And then google maps told me I could get a bus nearby, so I walked alone for a bit. There was a bunch of bus stops but it was unclear what bus I should take. So I walked on.

And presently an empty taxi came that way. And I hopped in. The taxi driver told me that my hotel is “one of the several old office complexes that have now become hotels” in Liverpool, “all thanks to the football”, he said. The room does look weird. It’s among the smallest hotel rooms I’ve stayed in, perhaps smaller than the one in Hong Kong.

I dont have the enthu to get up now, so here’s a photo of my room from my bed (that glass wall you see on the left is the bathroom). I trust what my taxi driver told me – I can fully imagine this little space having been a meeting room or office cabin once upon a time.

Anyways, off to bed now. Anfield beckons tomorrow morning! Never mind today’s derby result, and that we’re behind in the title race now.

Premier League Points Efficiency

It would be tautological to say that you win in football by scoring more goals than your opponent. What is interesting is that scoring more goals and letting in fewer works across games in a season as well, as data from the English Premier League shows.

We had seen an inkling of this last year, when I had showed that points in the Premier League were highly correlated with goal difference (96% R square for those that are interested). A little past the midway point of the current season and the correlation holds – 96% again.

In other words, a team’s goal difference (number of goals scored minus goals let in) can explain 96% of the variance in the number of points gained by the team in the season so far. The point of this post is to focus on the rest.

In the above image, the blue line is the line of best fit (or regression line). This line predicts the number of points scored by a team given their goal difference. Teams located above this line have been more efficient or lucky – they have got more points than their goal different would suggest. Teams below this line have been less efficient or unlucky – their goal difference has been distributed badly across games, leading to fewer points than the team should have got.

Manchester City seem to be extremely unlucky this season, in that they have scored about five fewer points than what their goal difference suggests. The other teams close to the top of the league are all above the line – showing they’ve been more efficient in the way their goals have been distributed (Spurs and Arsenal have been luckier than ManYoo, Chelski and Liverpool).

At the other end of the table, Huddersfield Town have been unlucky – their goal difference suggests they should have had four more points – a big difference for a relegation threatened team. Southampton, Newcastle and Crystal Palace are also in the same boat.

Finally, the use of goal difference is used to break ties in league tables is an attempt to undo the luck (or lack of it) that would have resulted in teams under- or over-performing in terms of points given the number of goals they’ve scored and let in. Some teams would have gotten much more (or less) points than deserved by sheer dint of their goals having been distributed better across matches (big losses and narrow wins). The use of goal difference is a small attempt to set that right.

Football Elo Application

This morning, I discovered the Club Elo Ratings, and promptly proceeded to analyse Liverpool FC’s performance over the years based on these ratings, and then correlated the performance by manager.

Then, playing around with the data of different clubs, I realised that there are plenty more stories to be told using this data, and they are best told by people who are passionate about their respective clubs. So the best thing I could do is to put the data out there (in a form similar to what I did for Liverpool), so that people can analyse how their clubs have performed over the years, and under different managers.

Sitting beside me as I was doing this analysis, my wife popped in with a pertinent observation. Now, she doesn’t watch football. She hates it that I watch so much football. Nevertheless, she has a strong eye for metrics. And watching me analyse club performance by manager, she asked me if I can analyse manager performance by club!

And so I’ve added that as well to the Shiny app that I’ve built. It might look a bit clunky, with two unrelate graphs, one on top of the other, but since the two are strongly related, it makes sense to have both in the same app. The managers listed in the bottom dropdown are those who have managed at least two clubs in the Premier League.

If you’re interested in Premier League football, you should definitely check out the app. I think there are some interesting insights to be gleaned (such as what I presented in this morning’s post).

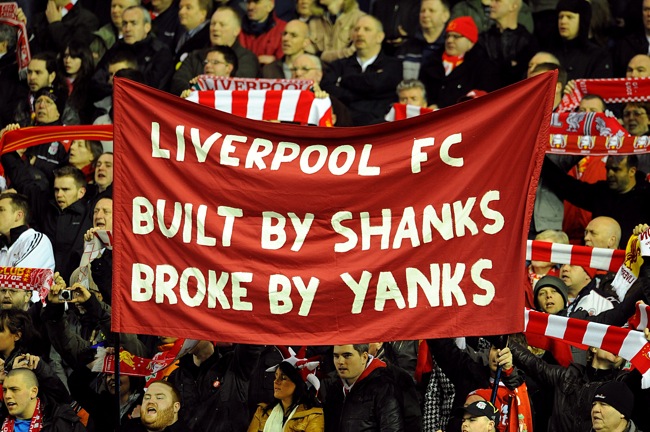
Built by Shanks

This morning, I found this tweet by John Burn-Murdoch, a statistician at the Financial Times, about a graphic he had made for a Simon Kuper (of Soccernomics fame) piece on Jose Mourinho.

Burn-Murdoch also helpfully shared the code he had written to produce this graphic, through which I discovered ClubElo, a website that produces chess-style Elo ratings for football clubs. They have a free and open API, through which Burn-Murdoch got the data for the above graphic, and which I used to download all-time Elo ratings for all clubs available (I can be greedy that way).

So the first order of business was to see how Liverpool’s rating has moved over time. The initial graph looked interesting, but not very interesting, so I decided to overlay it with periods of managerial regimes (the latter data I got through wikipedia). And this is what the all-time Elo rating of Liverpool looks like.

It is easy to see that the biggest improvement in the club’s performance came under the long reign of Bill Shankly (no surprises there), who took them from the Second Division to winning the old First Division. There was  brief dip when Shankly retired and his assistant Bob Paisley took over (might this be the time when Paisley got intimidated by Shankly’s frequent visits to the club, and then asked him not to come any more?), but Paisley consolidated on Shankly’s improvement to lead the club to its first three European Cups.

Around 2010, when the club was owned by Americans Tom Hicks and George Gillett and on a decline in terms of performance, this banner became popular at Anfield.

The Yanks were subsequently yanked following a protracted court battle, to be replaced by another Yank (John W Henry), under whose ownership the club has done much better. What is also interesting from the above graph is the managerial change decisions.

At the time, Kenny Dalglish’s sacking at the end of the 2011-12 season (which ended with Liverpool losing the FA Cup final to Chelsea) seemed unfair, but the Elo rating shows that the club’s rating had fallen below the level when Dalglish took over (initially as caretaker). Then there was a steep ascent under Brendan Rodgers (leading to second in 2013-14), when Suarez bit and got sold and the team went into deep decline.

Again, we can see that Rodgers got sacked when the team had reverted to the rating that he had started off with. That’s when Jurgen Klopp came in, and thankfully so far there has been a much longer period of ascendance (which will hopefully continue). It is interesting to see, though, that the club’s current rating is still nowhere near the peak reached under Rafa Benitez (in the 2008-9 title challenge).

Impressed by the story that Elo Ratings could tell, I got data on all Premier League managers, and decided to repeat the analysis for all clubs. Here is what the analysis for the so-called “top 6” clubs returns:

We see, for example, that Chelsea’s ascendancy started not with Mourinho’s first term as manager, but towards the end of Ranieri’s term – when Roman Abramovich had made his investment. We find that Jose Mourinho actually made up for the decline under David Moyes and Louis van Gaal, and then started losing it. In that sense, Manchester United have got their sacking timing right (though they were already in decline by the time they finished last season in second place).

Manchester City also seem to have done pretty well in terms of the timing of managerial changes. And Spurs’s belief in Mauricio Pochettino, who started off badly, seems to have paid off.

I wonder why Elo Ratings haven’t made more impact in sports other than chess!

What Ails Liverpool

So Liverpool FC has had a mixed season so far. They’re second in the Premier League with 36 points from 14 games (only points dropped being draws against ManCity, Chelsea and Arsenal), but are on the verge of going out of the Champions League, having lost all three away games.

Yesterday’s win over Everton was damn lucky, down to a 96th minute freak goal scored by Divock Origi (I’d forgotten he’s still at the club). Last weekend’s 3-0 against Watford wasn’t as comfortable as the scoreline suggested, the scoreline having been opened only midway through the second half. The 2-0 against Fulham before that was similarly a close-fought game.

Of concern to most Liverpool fans has been the form of the starting front three – Mo Salah, Roberto Firmino and Sadio Mane. The trio has missed a host of chances this season, and the team has looked incredibly ineffective in the away losses in the Champions League (the only shot on target in the 2-1 loss against PSG being the penalty that was scored by Milner).

There are positives, of course. The defence has been tightened considerably compared to last season. Liverpool aren’t leaking goals the way they did last season. There have been quite a few clean sheets so far this season. So far there has been no repeat of last season’s situation where they went 4-1 up against ManCity, only to quickly let in two goals and then set up a tense finish.

So my theory is this – each of the front three of Liverpool has an incredibly low strike rate. I don’t know if the xG stat captures this, but the number of chances required by each of Mane, Salah and Firmino before they can convert is rather low. If the average striker converts one in two chances, all of these guys convert one in four (these numbers are pulled out of thin air. I haven’t looked at the statistics).

And even during the “glory days” of last season when Liverpool was scoring like crazy, this low strike rate remained. Instead, what helped then was a massive increase in the number of chances created. The one game I watched live (against Spurs at Wembley), what struck me was the number of chances Salah kept missing. But as the chances kept getting created, he ultimately scored one (Liverpool lost 4-1).

What I suspect is that as Klopp decided to tighten things up at the back this season, the number of chances being created has dropped. And with the low strike rate of each of the front three, this lower number of chances translates into much lower number of goals being scored. If we want last season’s scoring rate, we might also have to accept last season’s concession rate (though this season’s goalie is much much better).

There ain’t no such thing as a free lunch.