Why Mourinho failed at ManYoo

Yesterday, Baada and I decided to try and record one of our recent WhatsApp conversations and release it as a podcast. I was in charge of tech, and I messed up massively. I was using Skype, and for whatever reason, it appears that my phone picked the microphone input from the phone itself and not from the AirPods I was using, so my voice came very faintly. Baada’s voice came well, though.

Leading up to the podcast, both of us had done our homework, so it’s a pity that it didn’t come out well and we can’t release it. The topic of the podcast was what kind of strategy, tactics and formations Jose Mourinho will use at Spurs. As part of our preparation, we had looked at the formations that he had used in each of his previous six clubs (Porto, Chelsea (1), Inter, Real Madrid, Chelsea (2) and Manchester United). There was one clear trend.

There are a number of positions that Mourinho prefers, and we were able to identify players in his first five clubs who occupied that position. And when it came to ManYoo, we drew a blank. This happened repeatedly as we talked through his possible formations and possible personnel to use at Spurs.

For example, Mourinho has a history of playing a Number Ten, and giving him a largely free role, encouraging him to get forward and score. Deco at Porto, Lampard at Chelsea 1, Sneijder at Inter, Ozil at Madrid, Hazard at Chelsea 2. And nobody at ManYoo! Through the Mourinho years, ManYoo didn’t have a proper Number Ten (and they don’t have one now) – it’s almost like a Number Ten wasn’t part of the ManYoo school of playing.

Then, people like to talk about Mourinho parking the bus, but an interesting feature of his game is that he uses a defensive midfielder who is good on the ball. Costinha at Porto. Makelele at Chelsea (he’s not that ultra-defensive midfielder commentators make him out to be – read Michael Cox’s Mixer to know more about him). Motta, Cambiasso and Zanetti at Inter. Xabi Alonso at Madrid. Nemanja Matic at Chelsea the second time round.

And again ManYoo didn’t have a comparable player. Mourinho took Matic along, but he didn’t do particularly well there (maybe he was past his prime?).

Then Mourinho likes a box-to-box midfielder who doesn’t mind doing dirty work. Essien in Chelsea 1, Khedira at Real. Ramires in Chelsea 2. Again ManYoo lacked such a player by the time Mourinho arrived (had he taken over earlier, maybe he might have used Paul Scholes in the role).

You can go on.

The remarkable thing is that Spurs actually have good personnel for most of the roles that Mourinho likes. They have an excellent Number Nine in Harry Kane. Dele Alli, Christian Eriksen and Hyong-Min Son are all capable of being the Number Ten (Alli is most likely to play there). Moussa Sissoko will be the box-to-box hardworking midfielder. Harry Winks can actually play the ball from central midfield. And so on.

So I expect Mourinho to do better with Spurs than he did with Manyoo. Even if he doesn’t have the budget to buy players of his choice in the next window.

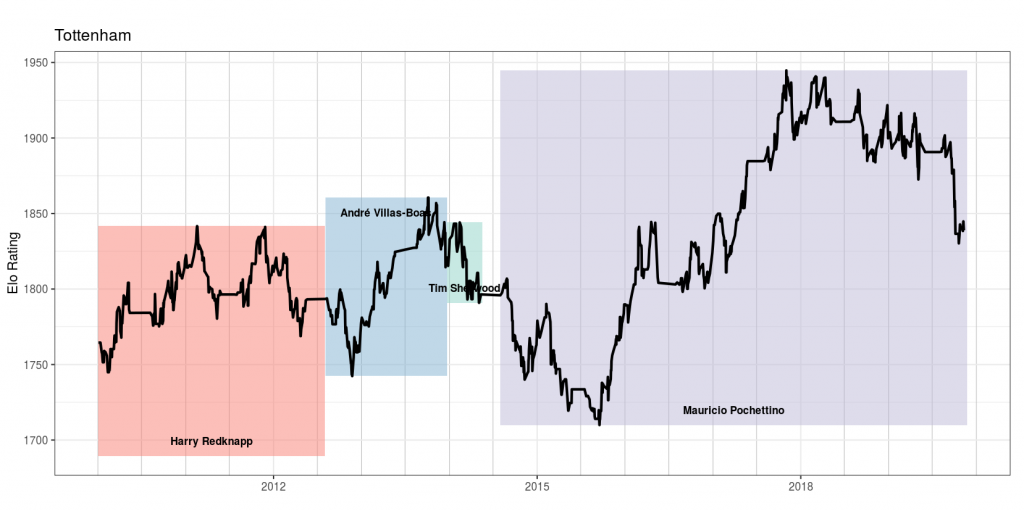
Spurs right to sack Pochettino?

A few months back, I built my “football club elo by manager” visualisation. Essentially, we take the week-by-week Premier League Elo ratings from ClubElo and overlay it with managerial tenures.

A clear pattern emerges – a lot of Premier League sackings have been consistent with clubs going down significantly in terms of Elo Ratings. For example, we have seen that Liverpool sacked Rafa Benitez, Kenny Dalglish (in 2012) and Brendan Rodgers all at the right time, and that similarly Manchester United sacked Jose Mourinho when he brought them back to below where he started.

And now the news comes in that Spurs have joined the party, sacking long-time coach Mauricio Pochettino. What I find interesting is the timing of the sacking – while international breaks are usually a popular time to change managers (the two week gap in fixtures gives a club some time to adjust), most sackings happen in the first week of the international break.

The Pochettino sacking is surprising in that it has come towards the end of the international break, giving the club four days before their next fixture (a derby at the struggling West Ham). However, the Guardian reports that Spurs are close to hiring Jose Mourinho, and that might explain the timing of the sacking.

So were Spurs right in sacking Pochettino, barely six months after he took them to a Champions League final? Let’s look at the Spurs story under Pochettino using Elo ratings. 


Pochettino took over in 2014 after an underwhelming 2013-14 when the club struggled under Andre Villas Boas and then Tim Sherwood. Initially, results weren’t too promising, as he took them from a 1800 rating down to 1700.

However, chairman Daniel Levy’s patience paid off, and the club mounted a serious challenge to Leicester in the 2015-16 season before falling away towards the end of the season, finishing third behind Arsenal. As the Elo shows, the improvement continued, as the club remained in Champions League places through the course of Pochettino’s reign.

Personally, the “highlight” of Pochettino’s reign was Spurs’ 4-1 demolition of Liverpool at Wembley in October 2017, a game I happened to watch at the stadium. And as per the Elo ratings the club plateaued shortly after that.

If that plateau had continued,  I suppose Pochettino would have remained in his job, giving the team regular Champions League football. This season, however, has been a disaster.

Spurs are 13 points below what they had scored in comparable fixtures last season, and unlikely to finish in the top six even. Their Elo has also dropped below 1850 for the first time since 2016-17. While that is still higher than where Pochettino started off at, the precipitous drop in recent times has meant that the club has possibly taken the right call in sacking Pochettino.

If Mourinho does replace him (it looks likely, as per the Guardian), it will present a personal problem for me – for over a decade now, Tottenham have been my “second team” in the top half of the Premier League, behind Liverpool. That cannot continue if Mourinho takes over. I’m wondering who to shift my allegiance to – it will have to be either Leicester or (horror of horrors) Chelsea!

EPL: Mid-Season Review

Going into the November international break, Liverpool are eight points ahead at the top of the Premier League. Defending champions Manchester City have slipped to fourth place following their loss to Liverpool. The question most commentators are asking is if Liverpool can hold on to this lead.

We are two-thirds of the way through the first round robin of the premier league. The thing with evaluating league standings midway through the round robin is that it doesn’t account for the fixture list. For example, Liverpool have finished playing the rest of the “big six” (or seven, if you include Leicester), but Manchester City have many games to go among the top teams.

So my practice over the years has been to compare team performance to corresponding fixtures in the previous season, and to look at the points difference. Then, assuming the rest of the season goes just like last year, we can project who is likely to end up where.

Now, relegation and promotion introduces a source of complication, but we can “solve” that by replacing last season’s relegated teams with this season’s promoted teams (18th by Championship winners, 19th by Championship runners-up, and 20th by Championship playoff winners).

It’s not the first time I’m doing this analysis. I’d done it once in 2013-14, and once in 2014-15. You will notice that the graphs look similar as well – that’s how lazy I am.

Anyways, this is the points differential thus far compared to corresponding fixtures of last season. 


Leicester are the most improved team from last season, having scored 8 points more than in corresponding fixtures from last season. Sheffield United, albeit starting from a low base, have done extremely well as well. And last season’s runners-up Liverpool are on a plus 6.

The team that has done worst relative to last season is Tottenham Hotspur, at minus 13. Key players entering the final years of their contract and not signing extensions, and scanty recruitment over the last 2-3 years, haven’t helped. And then there is Manchester City at minus 9!

So assuming the rest of the season’s fixtures go according to last season’s corresponding fixtures, what will the final table look  like at the end of the season?
We see that if Liverpool replicate their results from last season for the rest of the fixtures, they should win the league comfortably.

What is more interesting is the gaps between 1-2, 2-3 and 3-4. Each of the top three positions is likely to be decided “comfortably”, with a fairly congested mid-table.

As mentioned earlier, this kind of analysis is unfair to the promoted teams. It is highly unlikely that Sheffield will get relegated based on the start they’ve had.

We’ll repeat this analysis after a couple of months to see where the league stands!

Prodigy

Sometimes I wonder if being a prodigy is more of a curse than a blessing. The sense of having “achieved something” fairly early in life leads to a lowering of objectives, not being excited by anything, and a sort of satisfaction of having “arrived” that reduces motivation to do anything else in life.

A few prodigies keep up the fight and make a successful career for themselves as adults (eg. Sachin Tendulkar). Most fall by the wayside. And find it struggle to come to terms of having become ordinary. And find being an adult incredibly hard, and then get into all sorts of issues.

Five years ago, the Guardian identified the “best young player from each Premier League club“, and they’ve kept at monitoring the progress. Five years later, the results aren’t encouraging.

Out of our 20 players from the English top flight in that 2014-15 season, only three are playing at Premier League clubs now: Marcus Rashford, Dominic Solanke and Hamza Choudhury.

That may not sound very impressive but some others are at Premier League clubs but on loan in the Championship. Six of the 20 are playing second-tier football (five in England and one, Harley Willard, in Iceland) so nearly half are playing at a very high level. On the other hand, two of the 20 – as far as we are aware – are not playing football any more.

While it is natural for parents to push their kids and get them to “achieve something” at a young age, such achievements in most cases don’t result in any lasting advantage as adults. Instead, children who achieve something get labelled as “prodigies” or “gifted” or “talented” and these labels only seek to increase pressures on them as they grow up, rather than helping them build sustainable careers.

OK I might be ranting so I’ll stop here.

Data, football and astrology

Jonathan Wilson has an amusing article on data and football, and how many data-oriented managers in football have also been incredibly superstitious.

This is in response to BT Sport’s (one of the UK broadcasters of the Premier League) announcement of it’s “Unscripted” promotion where “some of the world’s foremost experts in both sports and artificial intelligence to produce a groundbreaking prophecy of the forthcoming season”.

Wilson writes:

I was reminded also of the 1982 film adaptation of Agatha Christie’s 1939 novel Murder is Easy in which a computer scientist played by Bill Bixby enters the details of the case into a programme he has coded to give the name of the murderer. As it turns out, the programmer knows this is nonsense and is merely trying to gauge the reaction of the heroine, played by Lesley-Anne Down, when her name flashes on the screen.

But this, of course, is not what data-based analysis is for. Its predictive element deals in probability not prophecy. It is not possessed of some oracular genius. (That said, it is an intriguing metaphysical question: what if you had all the data, not just ability and fitness, but every detail of players’ diet, relationships and mental state, the angle of blades of grass on the pitch, an assessment of how the breathing of fans affected air flow in the stadium … would the game’s course then be inevitable?)

This reminded me of my own piece that I wrote last year about how data science “is simply the new astrology“.

Liverpool FC: 2014 vs 2019

Last night I watched the first half of the Champions League semifinal between FC Barcelona and Liverpool FC, going off to bed when the score was 1-0 in favour of Barcelona. I woke up this morning to much dismay to see that Liverpool lost 3-0, but I’d constructed this post in my head when Liverpool was trailing 1-0, and so executing now.

It’s about the difference between the title-challenging Liverpool of 2014 and the title-challenging Liverpool of this season. Luis Suarez, in a brilliant interview with Sid Lowe, had mentioned that the current team is much better than the 2014 team, but last night’s Champions League game suggests that the two teams five years apart are simply two very different teams.

Last night Barcelona went ahead with a goal from Suarez in the 25th minute. It wasn’t an easy goal. There was a cross from the left by Jordi Alba, and Suarez got ahead, and managed to get the precise touch required to put it past Alisson into Liverpool’s goal. Liverpool had dominated the game until then, but with that one little half chance Suarez had converted.

Ten minutes later Sadio Mane got a chance to equalise, from a broadly similar chance. It was another ball above the defence from Mo Salah, but Mane hit it to the sky. And that was representative of Liverpool this season – both Mane and Salah have required lots of chances to score.

In that sense, Liverpool’s defence and midfield this season is far superior to the title-challenging side of 2014, when Suarez led the line. Back then few chances were created, but Suarez and an in-form Daniel Sturridge would take most of them, meaning that even with the midfield creating few chances and the defence leaking lots of goals, Liverpool could mount a challenge.

One could only imagine how this season’s team would have performed with someone of Suarez’s finishing ability leading the line. Salah, Mane and Firmino are no doubt a brilliant front three, but their conversion rate is low. If only one of them had a higher conversion rate, we wouldn’t have been struggling in both the League and the Champions League this season.


This is Anfield


I had a massive fanboy time this morning, as I went on my long-awaited (nearly 14 years) pilgrimage to Anfield, home of the Liverpool Football Club. As I had mentioned in my post last night, this was the explicit purpose of my visit to Liverpool, and I had left home with only three bookings – train to Liverpool, hotel in Liverpool and the Anfield tour.

So after having polished off a “large Full English” (in hindsight, I’m thankful for that) at a local cafe close to my hotel, I took an Uber to Anfield. The driver was also a Liverpool fan and we spent time chatting about last afternoon’s game, when Liverpool played insipidly to draw across Stanley Park with Everton. I was in good time for the tour (that was to start at 11), and spent the time walking along the outside of the Main Stand.

There are benches dedicated to Liverpool’s greatest players of all time, and the floor is tiled with names of members (not all members I think – perhaps those that made contributions to rebuild the Main Stand 3 years ago). I paid my respects at the Hillsborough Memorial and walked back to the Kop end where the entrance to the Stadium Tour is situated.

The tour started on the sixth floor of the newly redeveloped Main Stand (if you’ve wondered why TV broadcasts of Liverpool games suddenly started showing a very high angle, this is the reason). Our guide Terry first took us to the hall where there were photos of “Liverpool’s six great managers”.

The choices were interesting – Shankly, Paisley, Fagan, Dalglish, Houllier and Benitez. As the Elo ratings show, these were all definitely managers who improved Liverpool, sometimes in a significant way (though the last two also let things slip considerably towards the end of their reigns.

I sensed some sort of discomfort in the group. Evidently, a majority were Liverpool fans, but talks about “the purpose of the club being to win trophies” and talking up of the number of trophies won so far brought up the painful reality that we’ve “AJMd” on a league, a europa league and a champions league in the last five years itself, and look on course to AJM the league once again. Nobody really wanted to point out that things aren’t going as well as we would like.

In any case, the tour moved on and our guide Terry was excellent, though sometimes he went back to familiar cliches. Describing the miracle of Istanbul, for example, he made the familiar joke of “Milan had Kaka, and we had Djimi Traore, and yet we managed to win”.

We moved on to a view of the pitch from the highest tier of the main stand, my first impression was that this is a rather “cosy” stadium. Now, the only other stadiums I’ve been to are the behemoths Camp Nou and Wembley, and in comparison to them, Anfield looked rather intimate. That also suggested why the crowd at Anfield is sometimes like “Liverpool’s 12th man”, as a poster outside the away dressing room claimed.

The small stadium means the crowd noise can reverberate easily around the stadium. The Anfield Road End is yet to be redeveloped, and once that happens the stadium will become “taller”, meaning the noise levels might get higher. Looking at the pitch from up the Main Stand gave me another regret – that I haven’t watched a game at Anfield (though I did watch Liverpool play at Wembley). Hopefully sometime in this lifetime I’ll fulfil that!

There were cutouts of various players placed near the dressing rooms. Salah’s was the most popular as everyone lined up to take a selfie with him. Rather than waiting there, I managed selfies with cutouts of all of Firmino, van Dijk and Alisson. The dressing rooms were impressive (especially the Home dressing room). I also found the differences between home and away dressing rooms interesting – the home room is soundproof while the away room isn’t. The home room has lighting control to adjust the lighting to the pitch. The away room has no such facilities. These are subtle differences we don’t appreciate as TV viewers, but can have a profound impact on the game.

And based on this, I don’t mind the draws at Manchester United and Everton that much!


You’ll Never Walk Alone

I first became a fan of Liverpool FC in April 2005, on the day of the first leg of their Champions League semifinal against Chelsea. While I was in London for a month and half after that, I never really executed on the pilgrimage to Anfield. Instead I went on trips around the country which my friends had planned.

For a long time, this was on my To-Do list. Yet, I continued to be lazy. I moved to England exactly two years ago, but had somehow kept putting off my trip to Liverpool. The initial plan had been to do it with family, carrying my daughter as she put her hands on the “this is anfield” signboard.

Finally, as it happens, I’ve made the trip just before we end our current stint in London and move back to India. And unlike that plan of that photo-op of my daughter with her hand on the “this is anfield” sign, I’ve come to Liverpool alone.

I don’t know the last time I had one an “unplanned trip”. This time I did some planning, though, but haven’t booked much. As things stand now, I’ve only booked my train to Liverpool (which I took this evening), my hotel for the night (where I’m writing this from) and the Anfield tour for tomorrow morning.

In my eagerness to get to the hotel after the train rolled in to Liverpool Lime Street at 10:20 PM tonight, I exited the station without bothering to see where the taxi rank was. And then google maps told me I could get a bus nearby, so I walked alone for a bit. There was a bunch of bus stops but it was unclear what bus I should take. So I walked on.

And presently an empty taxi came that way. And I hopped in. The taxi driver told me that my hotel is “one of the several old office complexes that have now become hotels” in Liverpool, “all thanks to the football”, he said. The room does look weird. It’s among the smallest hotel rooms I’ve stayed in, perhaps smaller than the one in Hong Kong.

I dont have the enthu to get up now, so here’s a photo of my room from my bed (that glass wall you see on the left is the bathroom). I trust what my taxi driver told me – I can fully imagine this little space having been a meeting room or office cabin once upon a time.

Anyways, off to bed now. Anfield beckons tomorrow morning! Never mind today’s derby result, and that we’re behind in the title race now.

Vlogging!

The first seed was sown in my head by Harish “the Psycho” J, who told me a few months back that nobody reads blogs any more, and I should start making “analytics videos” to increase my reach and hopefully hit a new kind of audience with my work.

While the idea was great, I wasn’t sure for a long time what videos I could make. After all, I’m not the most technical guy around, and I had no patience for making videos on “how to use regression” and stuff like that. I needed a topic that would be both potentially catchy and something where I could add value. So the idea remained an idea.

For the last four or five years, my most common lunchtime activity has been to watch chess videos. I subscribe to the Youtube channels of Daniel King and Agadmator, and most days when I eat lunch alone at home are spent watching their analyses of games. Usually this routine gets disrupted on Fridays when the wife works from home (she positively hates these videos), but one Friday a couple of months back I decided to ignore her anyway and watch the videos (she was in her room working).

She had come out to serve herself to another serving of whatever she had made that day and saw me watching the videos. And suddenly asked me why I couldn’t make such videos as well. She has seen me work over the last seven years to build what I think is a fairly cool cricket visualisation, and said that I should use it to make little videos analysing cricket matches.

And since then my constant “background process” has been to prepare for these videos. Earlier, Stephen Rushe of Cricsheet used to unfailingly upload ball by ball data of all cricket matches as soon as they were done. However, two years back he went into “maintenance mode” and has stopped updating the data. And so I needed a method to get data as well.

Here, I must acknowledge the contributions of Joe Harris of White Ball Analytics, who not only showed me the APIs to get ball by ball data of cricket matches, but also gave very helpful inputs on how to make the visualisation more intuitive, and palatable to the normal cricket fan who hasn’t seen such a thing before. Joe has his own win probability model based on ball by ball data, which I think is possibly superior to mine in a lot of scenarios (my model does badly in high-scoring run chases), though I’ve continued to use my own model.

So finally the data is ready, and I have a much improved visualisation to what I had during the IPL last year, and I’ve created what I think is a nice app using the Shiny package that you can check out for yourself here. This covers all T20 international games, and you can use the app to see the “story of each game”.

And this is where the vlogging comes in – in order to explain how the model works and how to use it, I’ve created a short video. You can watch it here:

While I still have a long way to go in terms of my delivery, you can see that the video has come out rather well. There are no sync issues, and you see my face also in one corner. This was possible due to my school friend Sunil Kowlgi‘s Outklip app. It’s a pretty easy to use Chrome app, and the videos are immediately available on the platform. There is quick YouTube integration as well, for you to upload them.

And this is not a one time effort – going forward I’ll be making videos of limited overs games analysing them using my app, and posting them on my Youtube channel (or maybe I’ll make a new channel for these videos. I’ll keep you updated). I hope to become a regular Vlogger!

So in the meantime, watch the above video. And give my app a spin. Soon I’ll be releasing versions covering One Day Internationals and franchise T20s as well.


Premier League Points Efficiency

It would be tautological to say that you win in football by scoring more goals than your opponent. What is interesting is that scoring more goals and letting in fewer works across games in a season as well, as data from the English Premier League shows.

We had seen an inkling of this last year, when I had showed that points in the Premier League were highly correlated with goal difference (96% R square for those that are interested). A little past the midway point of the current season and the correlation holds – 96% again.

In other words, a team’s goal difference (number of goals scored minus goals let in) can explain 96% of the variance in the number of points gained by the team in the season so far. The point of this post is to focus on the rest.

In the above image, the blue line is the line of best fit (or regression line). This line predicts the number of points scored by a team given their goal difference. Teams located above this line have been more efficient or lucky – they have got more points than their goal different would suggest. Teams below this line have been less efficient or unlucky – their goal difference has been distributed badly across games, leading to fewer points than the team should have got.

Manchester City seem to be extremely unlucky this season, in that they have scored about five fewer points than what their goal difference suggests. The other teams close to the top of the league are all above the line – showing they’ve been more efficient in the way their goals have been distributed (Spurs and Arsenal have been luckier than ManYoo, Chelski and Liverpool).

At the other end of the table, Huddersfield Town have been unlucky – their goal difference suggests they should have had four more points – a big difference for a relegation threatened team. Southampton, Newcastle and Crystal Palace are also in the same boat.

Finally, the use of goal difference is used to break ties in league tables is an attempt to undo the luck (or lack of it) that would have resulted in teams under- or over-performing in terms of points given the number of goals they’ve scored and let in. Some teams would have gotten much more (or less) points than deserved by sheer dint of their goals having been distributed better across matches (big losses and narrow wins). The use of goal difference is a small attempt to set that right.